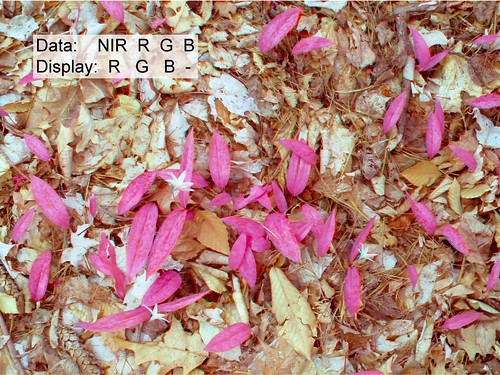
Infragram Media
A collection of images for the Infragram plant health camera project

(by Jeff Warren)
Fullsize Image Link

Caption: Normal color photo (top) and normalized difference vegetation index (NDVI) image (bottom). Healthy plants typically have NDVI values between 0.1 and 0.9. NDVI image was derived from two color channels in a single photo taken with a camera modified with a special infrared filter. Images by Chris Fastie.
Fullsize Image Link
Caption: Normal color photo (left), superblue infrared photo (middle), and normalized difference vegetation index (NDVI) image (right) of trailing arbutus. Healthy plants typically have NDVI values between 0.1 and 0.9. NDVI image was derived from two color channels in the single superblue photo which was taken with a camera modified with a special infrared filter. Images by Chris Fastie.
Fullsize Image Link
Caption: Normal color photo (left), and normalized difference vegetation index (NDVI) image (right). Healthy plants typically have NDVI values between 0.1 and 0.9. NDVI image was derived from two color channels in a single superblue photo which was taken with a camera modified with a special infrared filter. Images by Chris Fastie.
Fullsize Image Link (by Chris Fastie)
Fullsize Image Link


(by Chris Fastie)
Fullsize Image Link
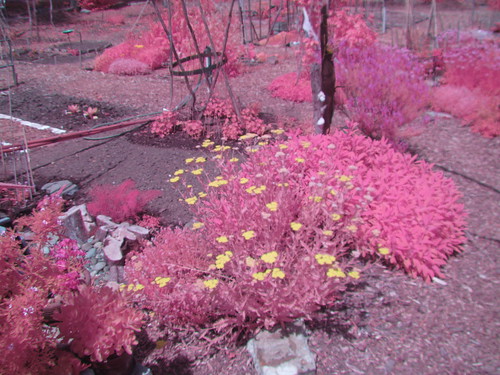
(by Mathew Lippincott)
Fullsize Image Link

(by Tom Taylor)
Fullsize Image Link

(by Chris Fastie)
Fullsize Image Link

(by Chris Fastie)
Fullsize Image Link

(by Don Blair and Ned Horning)
Fullsize Image Link

(by Jeff Warren)
Fullsize Image Link
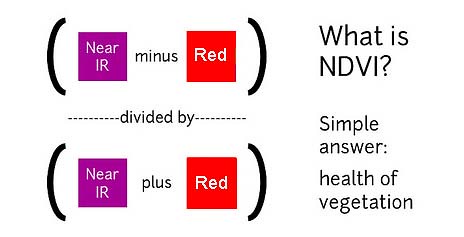
(by Chris Fastie)
Fullsize Image Link
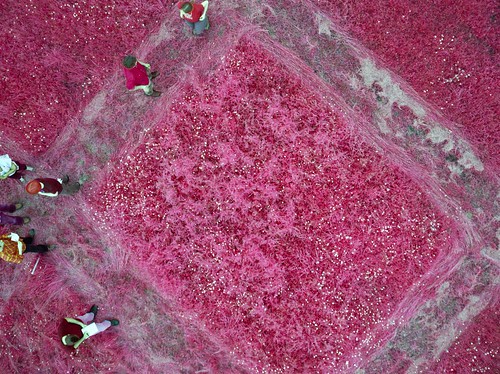
(by Chris Fastie)
Fullsize Image Link
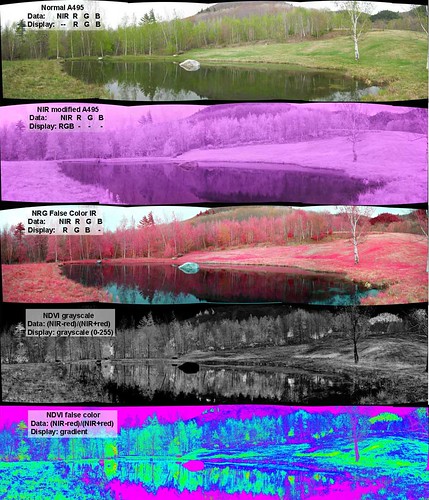
(by Chris Fastie)
Fullsize Image Link
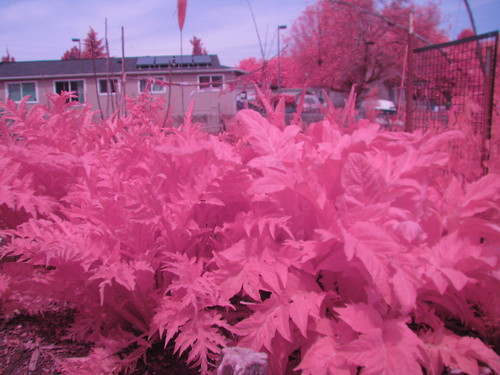
(by Mathew Lippincott)
Fullsize Image Link
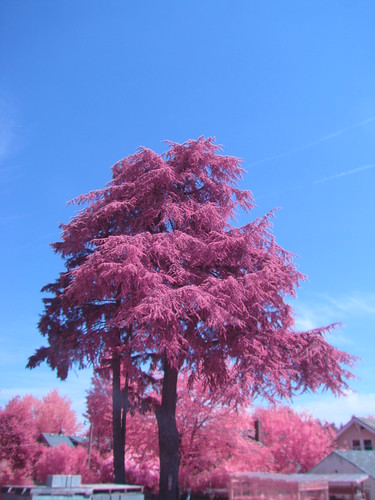
(by Mathew Lippincott)
Fullsize Image Link
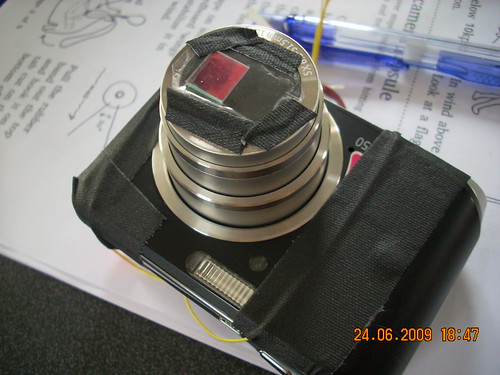
(by Jeff Warren)
Fullsize Image Link

(by Chris Fastie)
Fullsize Image Link
(by Jeff Warren)
Fullsize Image Link
 (by Jeff Warren)
Fullsize Image Link
(by Jeff Warren)
Fullsize Image Link
![]()
(by Chris Fastie)
Fullsize Image Link

(by Jeff Warren)
Fullsize Image Link
