
What I want to do
Following up on the various attempts to monitor gas refinery flares in Chalmette, LA, I wanted to try smoothing the data (by time-averaging it) to see if we could pick out some emission peaks.
My attempt and results
I started with a spectrum from July 27th by Scott Eustis from Chalmette, and used the "smooth_nosave" macro (pictured below) to average several seconds of data to smooth out the noise. This wouldn't have worked if the device had been moved at all during that time, since Scott's spectrometer has no slit (so it can't hold a calibration).

Click "Run" to run the macro

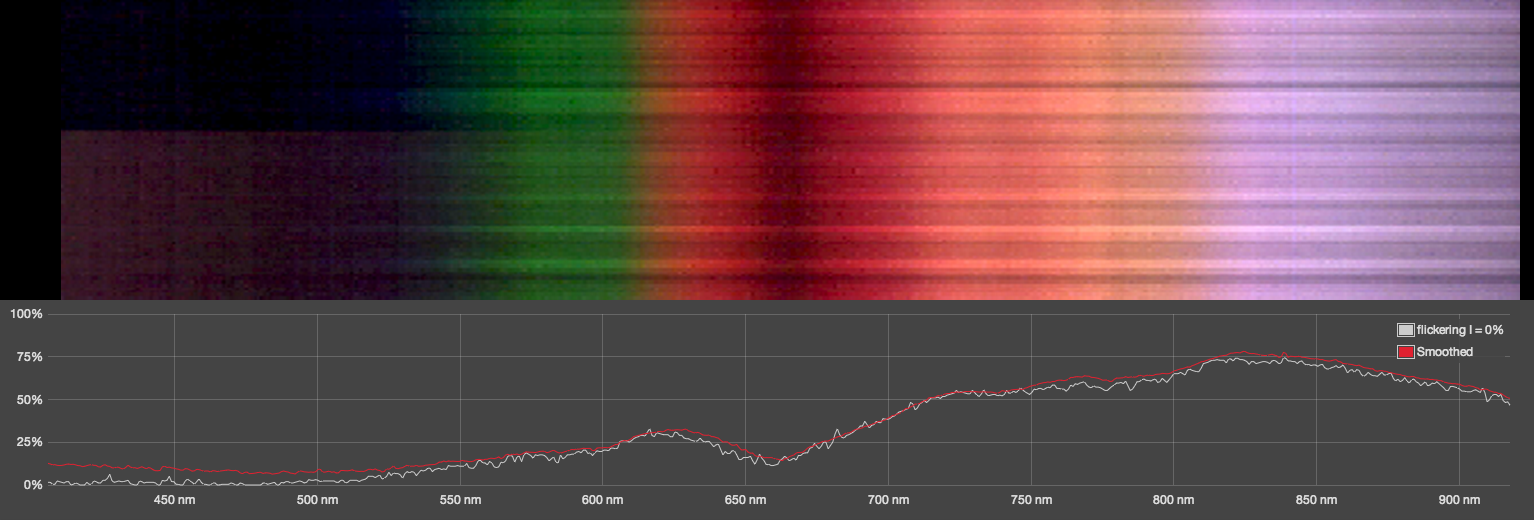
I've highlighted the tiny peak in this image, which is marked at 838 nm, but since I believe Scott's device is miscalibrated, that number may not be accurate. If you look at the lead image up top, you can see that the slightly brighter purple line is visible even without graphing.

Attempt to replicate
I repeated this with another spectrum from the same night and got the same little spike -- not very visible but still there -- and another around 734nm (again, maybe not a good number due to miscalibration):

I then repeated the smoothing technique with one of the spectra from last Monday's Chalmette trip, but didn't get the same emission line. That could've been because the flame did not have the same elements in it.

Questions and next steps
Not getting clear lines is not proof that this won't work -- it could also simply be because the elements are only present in trace amounts, or are not there at all on that given night. We should try to get a really solid calibration, and repeat this with all of the Chalmette flare spectra: https://spectralworkbench.org/tag/flare
2 Comments
Another thing to note is that the purple line is way out in the infrared (far enough that we know this despite the miscalibration) and NIST data we've imported spans only up to ~700nm (for example: https://spectralworkbench.org/analyze/spectrum/10864). I believe true NIST data goes higher (the gov shutdown has shuttered their site) but that the way we're doing the imports (via WebMineral.com) is just not displaying those higher lines.
Reply to this comment...
Log in to comment
Hmm, I'm worried that the ~840nm spike is just a camera artifact -- see how it's also represented in this spectrum of a halogen light through coca-cola: https://spectralworkbench.org/analyze/spectrum/14117
Reply to this comment...
Log in to comment
Login to comment.