Hello everyone ,
Public Lab takes utmost care in making sure that the location of a person is exposed to the extend he/she wants . Hence we here at Public Lab are working on giving people the power to safely share their location on the web .
I am happy to announce two new libraries that we are working for the past few weeks that helps in achieving this vision of ours .
In this post , i wish to introduce these new Public Lab open source software projects on Location Privacy .
Leaflet Blurred Location Display :
Leaflet-blurred-location-display (LBLD) is an extension of leaflet-blurred-location (LBL) and does the following:
- Cleverly displays your location, keeping your privacy settings in mind .
- Color code the markers on the map according to the precision .
- Shows heat map to analyze number of people at different rectangles of the grid .
- Fetches data from remote API or you may pass array of coordinates directly into LBLD API .
The demo is live :
1.) Shows Public Lab users location :
https://publiclab.github.io/leaflet-blurred-location-display/examples/index.html
2.) Shows how some locations (markers) are not shown at different zoom levels :
https://publiclab.github.io/leaflet-blurred-location-display/examples/example.html
So at Lower zoom levels , irrespective of the precision of coordinates you shared - your marker is visible on map . But as you zoom in to higher zoom levels , lower precision markers are removed .
To see details on how to use the LBLD library in your project , jump over to our github page : https://github.com/publiclab/leaflet-blurred-location-display
FEATURES AT GLANCE :
1.) Lower the precision , Greater the privacy :
The red markers corresponds to coordinates [23.1 , 77.1] , [20.1 , 76.1] having precision of 1 . At lower zoom level 5**** , these red markers are visible on map . 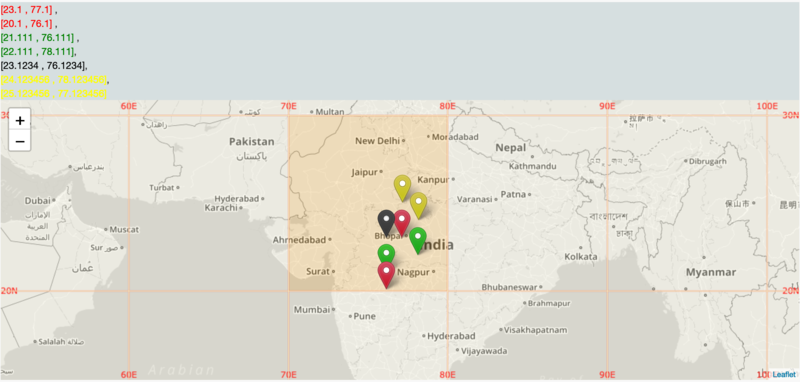
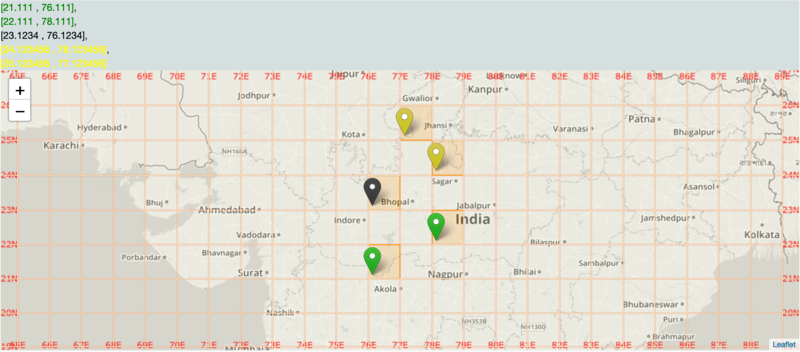
But as you zoom in to level 6 , these red markers are removed from the map whereas other high precision markers are still visible .
2.) Color Coding of the markers :
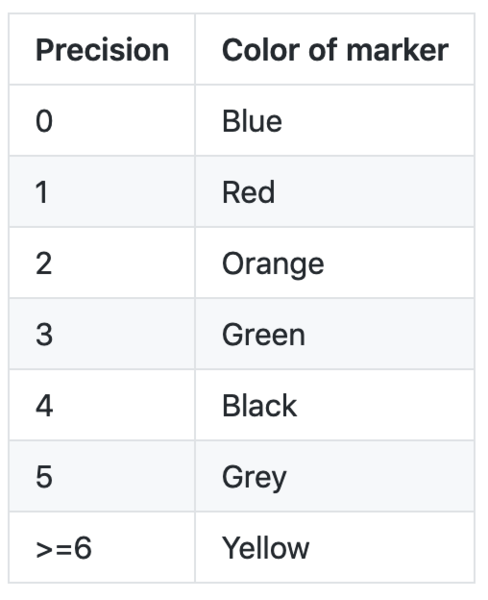
According to the precision of the coordinates , different colors are given to the markers .
Precision = 0 , Blue colored markers .
Precision = 1 , Red colored markers .
Precision = 2 , Orange colored markers .
Precision = 3 , Green colored markers .
Precision = 4 , Black colored markers .
Precision = 5 , Grey colored markers .
Precision >= 6 , Yellow colored markers .
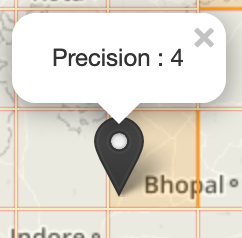
Also clicking the markers shows a pop-up telling the precision :
3.) Heat map :
Greater the markers in a region , Darker the color .
We wanted to give an easy visualization power , so we implemented this grid heat map .
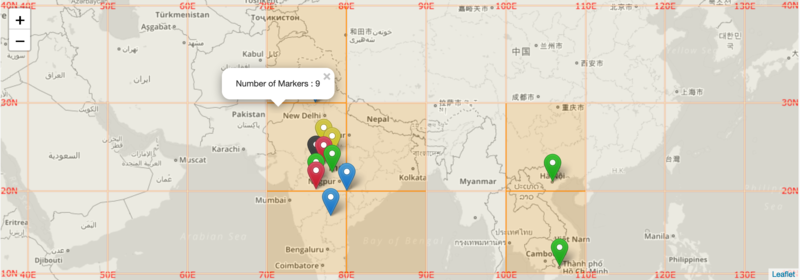
The default color of grid is : #F3F0C0
If number of markers are in range [1,10] , the color is : #FFA500
If number of markers are in range [11,15] , the color is : #faff05
If number of markers are in range [16,25] , the color is : #FF6347
If number of markers are in range [26,35] , the color is : #FF4500
If number of markers are in range [36,45] , the color is : #FF0000
If number of markers are greater than 45 , the color is :#8B0000
NOTE : Clicking on each rectangle shows the pop-up showing number of markers in that rectangle .
4.) Custom API and JSON parser :
You can pass your own API link to fetch data and show it on the map . Also you need to pass a JSON parser function to parse your API . See our Github page to know more details !
Blurred-Location library :
A JavaScript library to help manage variable location privacy through a "blurred location" model .
This library is an independent module which gives many mathematical functions that one can use on any map (not necessary Leaflet map!) . The library is thoroughly tested using Jasmine framework .
Jump over to the github page for more details of each mathematical function : https://github.com/publiclab/blurred-location
The npm link is : https://www.npmjs.com/package/blurred-location
If you have any suggestions or any doubts regarding the use of this library , kindly open an issue here .
I personally thanks @warren for mentoring me and giving all these awesome ideas .

5 Comments
Awesome work @sagarpreet @warren 🎉 💯
Reply to this comment...
Log in to comment
This is so great, @sagarpreet!!!! 🎉 you've done a fantastic job and these libraries are really coming to life!
For others -- these will soon start to be featured on the website here! For example on the https://publiclab.org/people page! 👍 🎉
Reply to this comment...
Log in to comment
Hi @liz , @stevie ,
I and @warren are working on integrating this library to /people page . I am hoping to get your opinion on :
1.) What should be the grid color coding we should use ?
2.) What should be the color of marker ?
It would be great if you post your answer here as well : https://github.com/publiclab/plots2/pull/5358#issuecomment-479473790 .
Thank you 😃 !
Is this a question? Click here to post it to the Questions page.
You can check these live demos here :
See how markers are filtered at different zoom levels : https://publiclab.github.io/leaflet-blurred-location-display/examples/example.html
See how markers are fetched from remote/external API : https://publiclab.github.io/leaflet-blurred-location-display/examples/index.html
This page shows how different zoom levels and different precisons corresponds to different Human Readable blurring : https://publiclab.github.io/leaflet-blurred-location-display/examples/HumanReadableBlurring.html
This page shows the style : heatmap property of this library which results in only colored grids without any markers : https://publiclab.github.io/leaflet-blurred-location-display/examples/simpleHeatmapStyle.html
Reply to this comment...
Log in to comment
Hi @sagarpreet these demos look amazing! To your questions above,
1) The gridline color in orange, with highlighted gridsquare in red looks great to me. A vibrant contrast with a blue-green planet. Open to other ideas if anyone has any!
2) The colors of the markers might work as a spectrum, maybe something from http://colorbrewer2.org
Reply to this comment...
Log in to comment
Login to comment.