About Me
Name: Isha Gupta
Affiliation: Indraprastha Institute of Information Technology, Delhi
Github: @IshaGupta18 (https://github.com/IshaGupta18)
Blog:https://medium.com/@ishagupta1828
Location: Delhi, India
Project Description
Abstract/ Summary (<20 words)
Sensor data upload and display library
Problem
The problem with CSV data is:
The data size is huge
The data can't be easily interpreted
No conclusion can be drawn from it without converting it to a more readable form
This is an important task in the research field as most of the data is in CSV format.
Public Lab collects data for its sensors and utilities like MapKnitter, Spectral Workbench etc. in CSV format.
In the research field, the task at hand should be thinking about new ideas and not putting that time in analysing raw data, irrespective of the fact whether you're a programmer or a non-programmer.
To make it easier for them to manage data and make the data more conclusive, a JavaScript + HTML based library should be developed to organize CSV sensor data into informative graphics like charts.
The library will be built and used as a feature on Public Lab but will remain as a standalone tool to be integrable.
It would be developed separately like the Rich Editor (https://github.com/publiclab/PublicLab.Editor) or Inline Markdown Editor (https://github.com/publiclab/inline-markdown-editor).
Index
Description of features
Flow
Part 1: Uploading CSV file through drag-and-drop
Part 2(a): Getting the uploaded file from input field
Part 2(b): Using previously uploaded files
Part 3: Parsing
Part 4: Displaying Sample data and getting columns selected
Part 5: Getting ALL the data
Plotting the Graphs
Browsable Time Slider
Displaying per-user data
Exporting CSV files to Google Sheets
Plotting Multiple Graphs from within the same sheet (using different columns' combination)
Publish as a Research Note
Saving Chart as an Image
Timeline
More About Me
Description of Features:
A simple menu for choosing the graph type
Different graph types with the best-suited color theme can be displayed:
Bar
Pie
Line
Radar
Doughnut
Scatter
Display the CSV data's columns and give the user the option to choose the columns for which the graph should be plotted:
A CSV file is usually very cluttered and not all columns out of it are useful.
The column headers with a couple of leading values should be displayed for the user to select the respective columns for X and Y axes to plot the data.
The labels for the axes will be picked up from column header titles.
The options given to the user for plotting should be simple and not too elaborate, for the purpose is just plotting the data on an environmental platform and too many features may drive the user away. This means that with some basic selections, the user should be presented with a graph.
A browsable/movable slider to display data in a graph:
During a particular time period (if time is the quantity on the x-axis).
In a particular range of values scaled according to the range of data on the x-axis.
Selecting the particular range or setting the slider value will magnify the graph for that region, giving a sharper look at the plot in that region.
A single click that converts the uploaded file into a Google Sheet and opens it in a new tab available for export. (using Google Sheets API importdata function)
Displaying per-user data:
A per-user record table showing a list of all CSVs uploaded by him/her in a separate page on Public Lab. Link <publiclab.org/data/username>
The record table will have a Download link for each CSV so that the user can download the uploaded CSV file(s).
The user can also delete a CSV file from his record table.
The user can also view the published note which he might have made with the plotted graph.
The user can plot multiple graphs for the CSV file on the same page, using an "Add Graph" button. This would help facilitate better analysis and comparisons between different data sets.
An option to publish the plotted chart as a research note, so that other users can view it and discuss on it via comments and blogs, and is also made available for them to use and subscribe to.
The user can also create charts from files they have uploaded before. At the time of plotting, they will be given an option to create charts from their previously uploaded CSVs. This promotes reusability of data.
Each graph plotted is given an option to be saved as an image. This makes it very convenient for the user to have the analysed data in an easy and accessible form.
Implementation
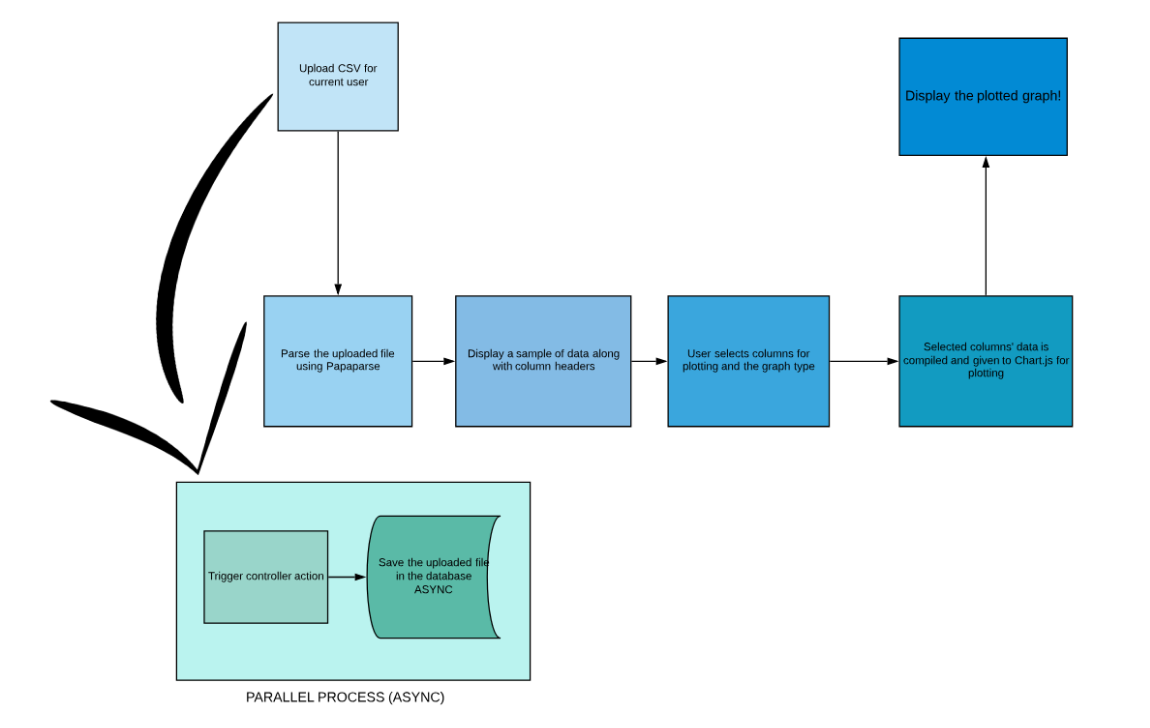
Flow:
Upload the CSV file through a form submission for the currently logged in user (AJAX).
The file is uploaded(local or remote) and saved asynchronously against the current user.
This file is saved in a one-to-many (since one user can upload multiple files for multiple graphs from his/her account) relationships table for the user.
This file is saved in the bucket in the database of the server using paperclip. (available for retrieval).
Get the uploaded file and parse:
The uploaded file is retrieved from the form and parsed using Papa Parse at the client side.
The uploaded file can be at the client's system or it can be a remote file, both are good to be handled by Papa Parse. OR
Upload file from previously uploaded file and pass the url to the parsing function.
A sample of the data is displayed from the file
We get all the data in the parsed form.
We want to show the column header names and some sample data for the user to choose the columns which will be used for plotting a graph.
We display a sample of the data (say first 10 rows) for selecting the columns.
Getting the names of required columns and type of graph
We now get the names of the required columns for plotting from the user through checkboxes and radio buttons.
The user selects the axes of the columns.
The user selects the type of graph to be plotted from a graph menu.
Data is compiled
The selected columns complete data, along with the graph types is combined in one JSON hash.
This hash is made available to Chart.js for plotting.
Chart.js plots the graph with the given data and finally displays it!

Part 1: Uploading CSV file through drag-and-drop and remote file
We make an input type="file" form which facilitates drag-drop-feature as well.(https://github.com/publiclab/plots2/pull/4538).
The form will be designed in such a way for the user to conveniently upload the file or drag it and drop it there.
There will also be a text field, for the user to give the link of a remote file.
In Plots2, we use Paperclip gem for uploading and saving files.
<https://github.com/publiclab/plots2/blob/6ea587e24f87fce9e1901744b72b15ec0ac48687/app/views/users/_create_form.html.erb#L43> has been used here for uploading optional profile picture at the time of sign-up.
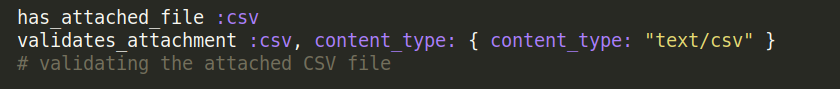
So once the file is dropped in the drop-zone for uploading or the link of a remote file is pasted in the text field and the upload button is clicked, it is saved against the user asynchronously in the table created (described later).
On clicking the Upload CSV button:
An AJAX request is sent to the controller action that would save the uploaded file against the user.
A success value is returned to show that the action has been successfully executed.
The following design is the upload part of the page where the Sensor Data library is implemented.
The "Plot charts from your files" button has been described later.

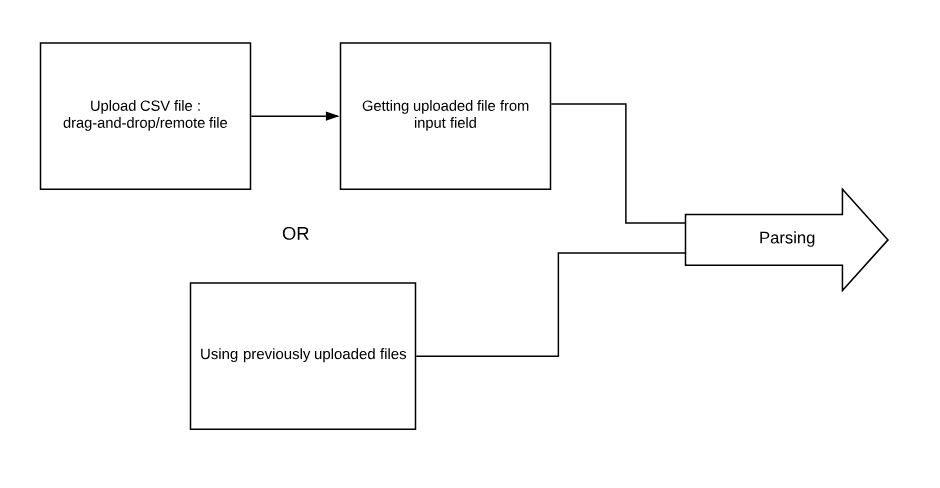
Part 2(a): Getting the uploaded file from input field
The uploaded file is extracted from the drag-drop input field and is made available for the parsing function.
The remote file URL is also extracted from the text-field.


In the above 2 cases, only one of the 2 variables ie "file" and "file_remote" will hold a value. We will check which of them is not null and pass it on to the parsing function.
The user can also choose from his/her previously uploaded files (described later).
In this case, none of the above two cases happens.
We simply get the path of the previously uploaded file from the server and pass it to the parsing function.
OR
Part 2 (b) Using previously uploaded files
(Part 1 and Part 2(a) are skipped if this is followed)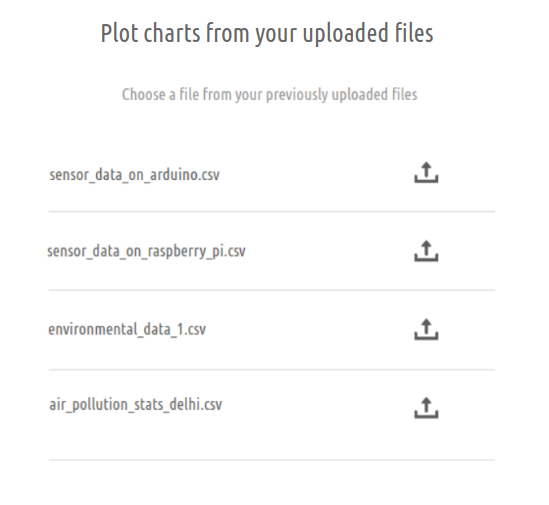
For the ease of the user and to promote reusability, the user can plot charts from the CSV files they uploaded previously.
These files are the ones that are saved against the user when they first uploaded them.
This list is displayed on the same page where the user can upload the CSV file, so that the reusability option is available at the time of upload.
After clicking on the upload button:
A request is made to the server to get the path of the corresponding file (in the same way, when it was made to fetch per user data).
The file's path is then sent to the parsing function for parsing.
Part 3: Parsing
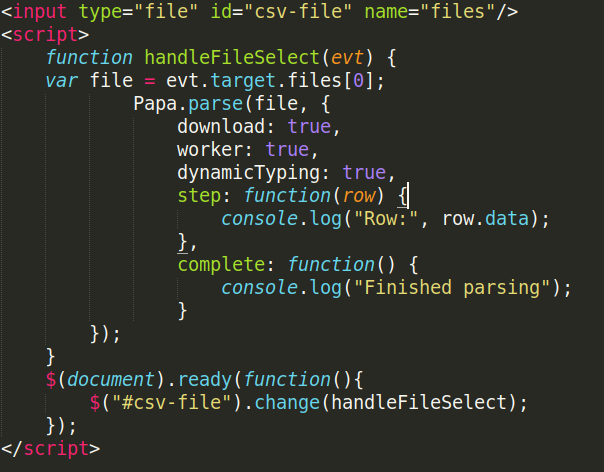
We will be using Papa Parse, which is very powerful JavaScript library that parses CSV files at the client-side (ie in the user's browser)
To include Papa Parse, we'll use it's CDN:
https://cdnjs.cloudflare.com/ajax/libs/PapaParse/4.6.3/papaparse.js
We'll keep download: true for both remote and local files to be accessible to Papa Parse.
It can handle large sized files. To do this, we will be traversing the file row-by-row so that the entire file is not loaded into the memory in one go and the browser doesn't crash.
We can also enable a worker thread(worker : true), just to be on the precautionary side.
We will enable dynamicTyping: true so that all data-types of the file data can be taken into account and kept as it is, not all of them as strings.
To get the header names, we can apply a technique:
The first row, if it contains the header names, then all the elements in that row will be of the same data type (mostly string).
If that doesn't happen, we assign dummy column names like col1,col2 etc.
This needs to be done to display the sample data and get the columns selected.
Detecting timestamps
To detect timestamps in the CSV, we can apply a string manipulation function on the first row of the CSV. The function will check the cell's string my slicing it and getting it into a common date time format like yyyy-mm-dd or hh-mm-ss.
If this is found to be true, we'll check for a couple of more values in that column which will ensure that the entire column has time stamps and can be potentially used for a range of time slider.
This column will be selected by default for the X-axis when the column selection data is displayed.
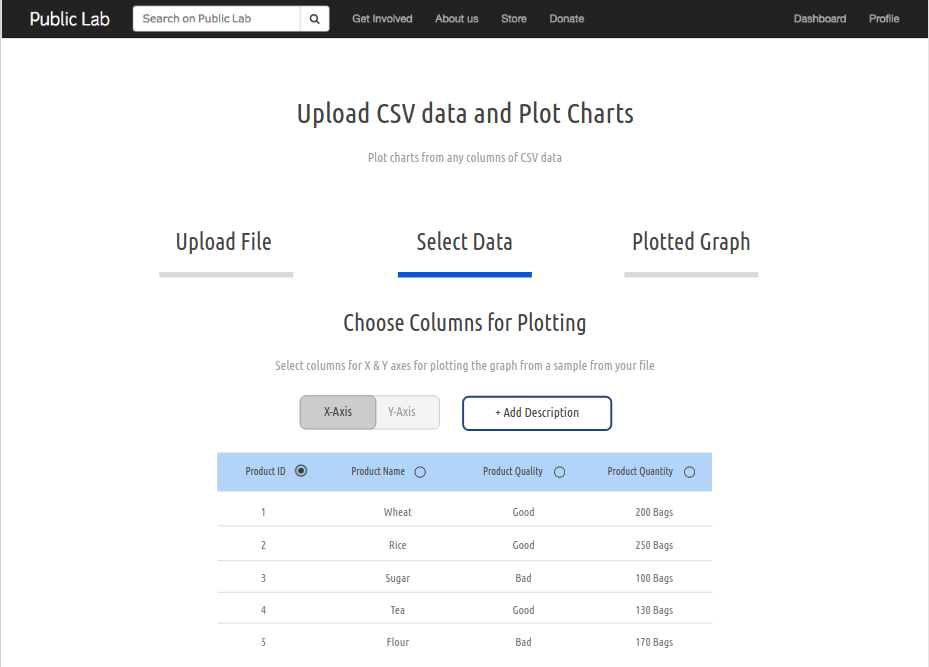
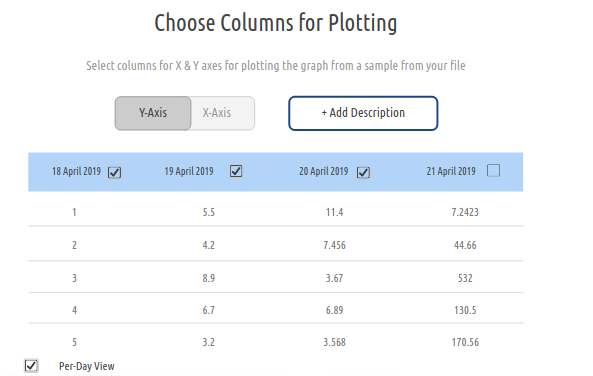
Part 4: Displaying Sample data and getting columns selected
We will display some sample data to the user and ask him/her for the columns to be selected, for which a graph will be plotted.
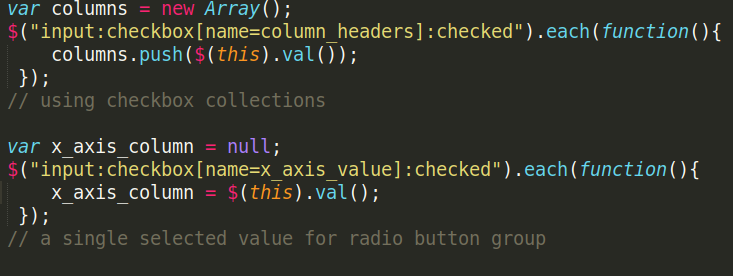
Since for X axis, only a single column can be selected, that will be implemented through radio buttons.
For Y axis, multiple columns can be selected, so this will be implemented through checkbox selection.
The graph type will be selected by the user through a graph menu (described later)

(When labels for X-axis to be selected)
(When labels for Y-axis to be selected)

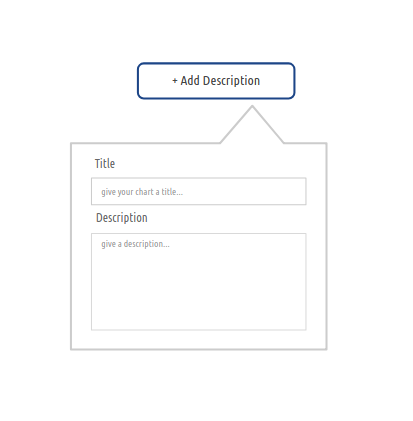
The "Add Description" button will open up a popover, where the user can add a title and a small description about the graph being plotted.
This information will be saved against this CSV and can be displayed along with per user data.
This information will also be displayed along with the graph and will be useful if the user wishes to publish it as a research note.
- We now need all the data to plot the graph
Part 5: Getting ALL the data
We have the column names for which we have to plot the charts and we have the graph type. We now need to get all the data (not just sample) for those columns and compile it into a hash form, so that chart.js can easily extract the information and do the plotting.
To do this, we just have to pick out the required columns from the parsed data.
The JSON data will be of the following format:
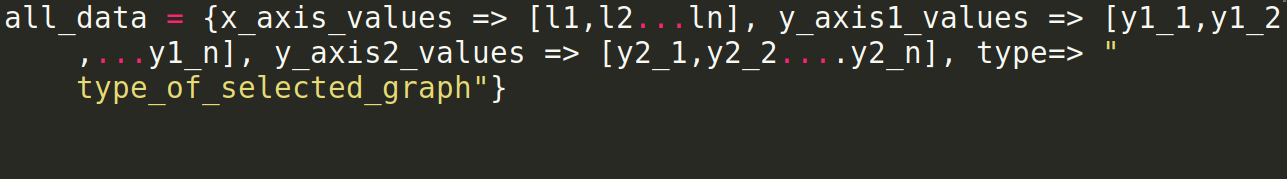
X-Axis has one array of values or labels.
Multiple data sets can be plotted using chart.js so for the Y-Axis, the user can select multiple columns and they will be taken as arrays of values.
With all the data in our hand, we can now give it to Chart.js for plotting.
Part 6: Plotting and displaying the graph!
- With the final, parsed data, we finally use Chart.js to plot the graph and display it to the user!
Plotting the Graphs
Moving to the more graphics part of the project, we now see how exactly we'll be plotting our graphs.
For this, we'll be using Chart.js, a javascript library designated especially for graph plotting.
We can use the CDN available for chart.js:
https://cdnjs.cloudflare.com/ajax/libs/Chart.js/2.7.3/Chart.js
We will be using this version of CDN because moment.js is already included in Plots2, so we don't need to use the bundled version, because it will reduce the page loading speed.
Including it as script tag:\

It has a variety of different configurations for displaying data through graphs and offers numerous graph types for the user to choose from.
Simple working in correspondence to the data we have:
We will get the JSON data in a compiled form after parsing with labels for x-axis as values and set(s) of values for y-axis as values and the label name say "dataset1" as keys for y-axis values.
The JSON will also have the type of graph to be plotted, which the user selects from the graph menu. The Graph Menu will provide basic graph types, with some sub-categories of each graph type that will be useful for the users and easy for them to understand.
We'll be using simple Chart.js documentation code https://github.com/chartjs/Chart.js and design it according to our needs and what all things to include while plotting the graph like:
Color Scheme
Tooltip design
Information in tooltips
Labels on Axes
Legends
The graphs can be made responsive by wrapping the "canvas" element in a container div and setting it's position as relative.
Below is the skeletal script for plotting function of graphs. The options part is for the design and will be written tailor-made for our site!

Different kinds of design options
This is how the menu will look like:
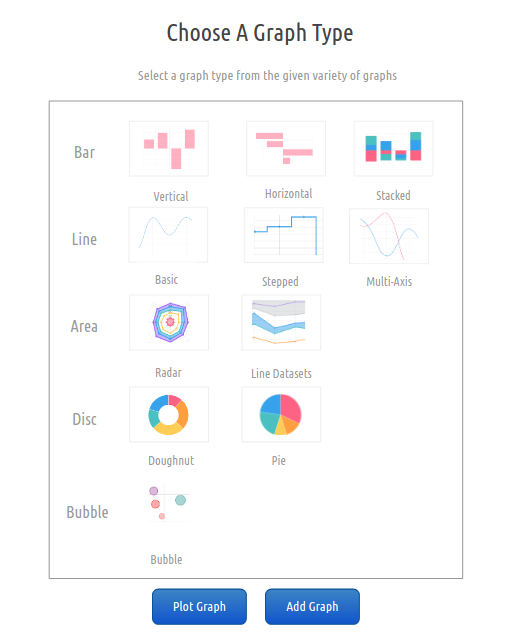
On clicking on a graph of a type, that type will be selected.
The graph options on the graph menu act like just hidden radio buttons and are sent as a parameter along with the selected columns and the type is used conveniently by Chart.js. However, the most frequently used chart type in sensor data is line, so that will be the default selection.
With all the information in hand (ie Column names for the axes and the graph type), we would finally plot the graph. On click of the "Plot Graph" button.

- The features of the buttons above are described later.
Browsable Time Slider
A time slider or a range slider is used to select a particular range of data and zoom in to the graph in that range.
It is typically useful in CSV files where the data size is usually large and a slider helps in giving a better insight of the graphical analysis.
It can be implemented through a plug-in designed for Chart.js library which is easy to use and integrate with our Sensor data library.
Github Link: <https://github.com/schme16/Chart.js-RangeSlider/>
The design will be changed and twerked up in accordance with the design scheme of the charts.
Here's how it looks in functioning :


To integrate into the graph-plotting JS file, we simply need to create a new class:
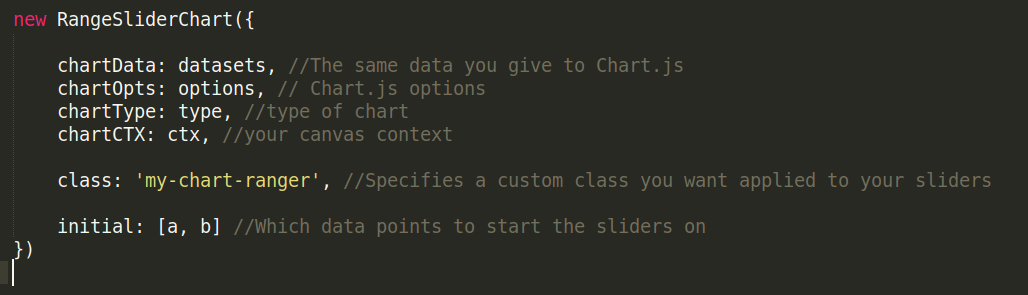
Here a and b would be the the values we initially want the slider to be set to, which should logically be the extreme values of the dataset, as initially we would be displaying all the data in the range and the user can adjust it according to their view frame.
The code will not be used directly and will be implemented separately so that no extra bugs are introduced and it is tailor-made according to our library.
These dependencies are needed to be resolved, only the noUISlider is the new one here:
jQuery
Chart.js
noUISlider
Per-Day View
For some kinds of data, like purple dust sensor data, we need a per-day view, because the quantity being measured changes around the same time everyday and dividing the graph in separate days for that gives a better analysis.
In this, the CSV file will be of the format:\
So once the user selects the dates for plotting, we can show a checkbox with the title "Per-Day View".
If this checkbox is checked, then the user doesn't have to select the graph type (in this case there will be multiple line graph and will be automatically selected) and each line of the graph will have a different colour for each date.
On the x-axis, the parameter could be time/hours of the day so that the user can get a view of the data at different points of time (and zoom it using the slider).

Displaying per-user data

Link: https://publiclab.org/data/username
This page will display a list of all the CSV files uploaded by a particular user and a link for each of them to be downloaded.
The files will be stored in a bucket in the server using paperclip at the time of upload and will be retrieved from there.
For doing this, we will be implementing a one-to-many relationship between a user and CSV files (one user can have multiple files).
So a user: has_many files and a file belongs_to a user.
Although a similar relation table for images is already in use, a new table is preferred so that the uploaded files can be used more efficiently for all intended purposes, which might be a little restricted if the image model is used. Also, since the image model is there, the structure of the CSVFile model will be on similar lines and the skeletal can be constructed easily with the available code.
PS: The user model is already created, this will just be an addition to it.
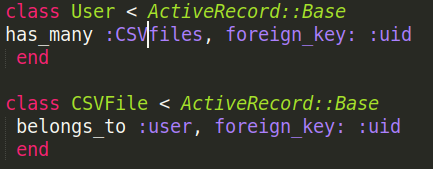
(foreign_key is to link both the tables)
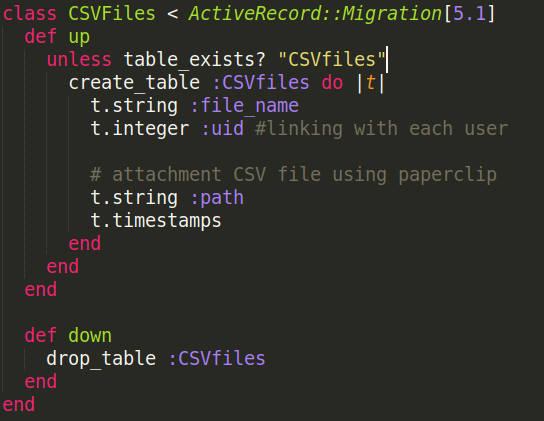
So we will create a new table called CSVFile which will have 4 columns, name:
File Id
User Id (the user to which the file belongs)
File Name
Path/location of the file in the server (or in the remote server)
To generate the table:
rails generate model CSVFile file_name:string, user_id:integer, path:string
The migration would look something like this:
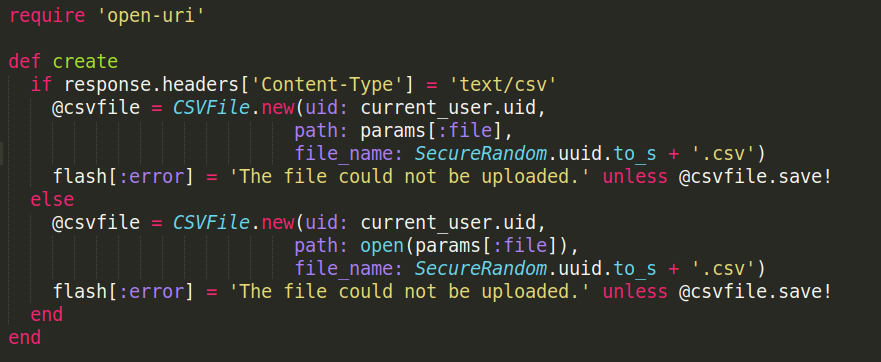
Storage
- Saving the file (the file is received at the time of upload via AJAX form submission):
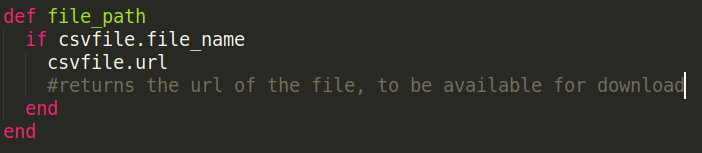
There will be a download icon button against the name of the file and on clicking on it:
A function will be written in the user model file and in the function, the corresponding file name will be searched in the relationship table, something like the profile_image column:
The file path will be returned by this function and will be put in the download icon's href parameter and will be made available for download.
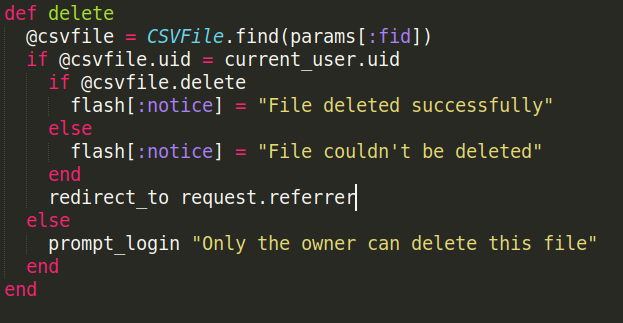
There will also be a "Delete File" button next to each file.
If the user wishes to remove a file from his database, he can do so by clicking on that button.
To do this, in the CSVFile controller:
There will also be a link to the research note the user might have published at the time of plotting (described later).
Exporting CSV files to Google Sheets
- Google Sheets API helps in creating CSV files to Google Sheets and exporting them
Flow:\

Here, we can export the CSV file data to a Google Sheet and open the newly created sheet through the API in a new tab.
This is because, since it is a Google Sheet, the exported sheet will require the user to login with their Google accounts (most of the users have a Google account) and then they can view the sheet and edit it as well.
To create a new sheet through API:\
To import the CSV data into the file we will use IMPORTDATA(url) function.
The url will be the path of our CSV file stored in our server.\
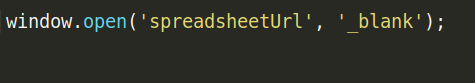
When we create a sheet, an instance of the spreadsheet is returned as the response, and that JSON contains 'spreadsheetUrl' parameter which has the url of the spreadsheet. We simply open the created sheet in a new tab.


Plotting Multiple Graphs from within the same sheet (using different columns' combination)
To facilitate better analysis, we can provide multiple graph plotting on a single page, something like what is shown below. This would allow the user to compare graphs easily as there are in the same page.
This would also enable them to create a report-like format, which can be used later.

Once the file is parsed and we have displayed the columns for selection, we display a "Add Graph" button next to Plot Graph button. This is because, once the user has selected the columns and graph type for the first data, he/she can choose to plot the graph or add another graph.
Whenever the user clicks on the "Add Graph" button, number of graphs (n, initialized with 1) is incremented by 1 and the user then selects the dataset and graph type for the next graph.

We get a different hash for each selected column set, we will just have to run that loop the number of times selected by the user. This will be light to do, since we just need to pick out the columns that are already parsed.
We will dynamically create canvas elements using JavaScript and run that loop n times to create n multiple graphs!

Publish as a Research Note
To increase the usage of the plotted graphs and to get multiple perspectives on the analysed data, there should be an option to publish the charts as a research note.
This way, other users will be able to view it and discuss around it via comments and blogs.
To do this, we will put the produced charts in a partial.
That partial will be available for rendering in:
The view which is displayed once the user clicks "Plot Graph".
In the https://github.com/publiclab/plots2/blob/master/app/views/notes/show.html.erb which shows the published research note.
When a user creates a new research note, the Public Lab editor (which is also a stand alone library) comes into play (https://github.com/publiclab/plots2/blob/master/app/views/editor/rich.html.erb)
A similar task will be performed, when the user clicks on the publish button, the partial (which was being displayed ) will be fetched by the plots2/app/views/notes/show.html.erb file and a new note will be created and published.

Creating charts from previously uploaded files
For the ease of the user and to promote reusability, the user can plot charts from the CSV files they uploaded previously.
These files are the ones that are saved against the user when they first uploaded them.
This list is displayed on the same page where the user can upload the CSV file, so that the reusability option is available at the time of upload.
After clicking on the upload button:
A request is made to the server to get the path of the corresponding file (in the same way, when it was made to fetch per user data).
The file's path is then sent to the parsing function for parsing.
After the selection, the normal flow of showing the sample data and plotting the chart continues.
Saving Chart as an Image
We can save the chart as JPEG image, for the user to download it as a copy.
We can convert any HTML canvas element to an image format using JavaScript's toDataURL() function.

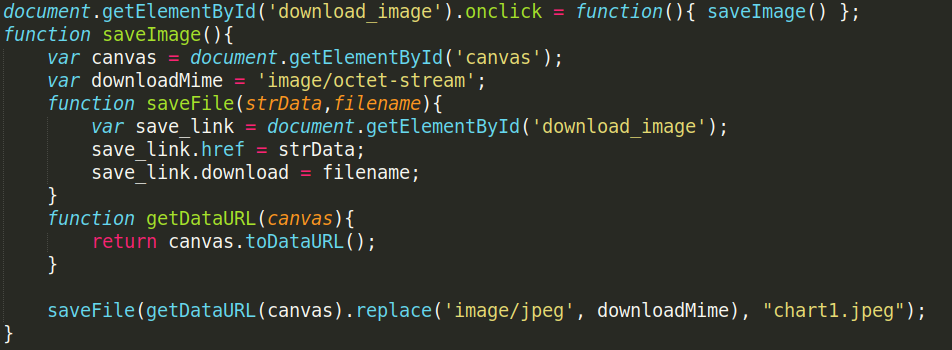
This provides the link to the image file that can be downloaded.
This url is set as the href attribute of button and on clicking on it, the chart is saved as an image on the user's machine.
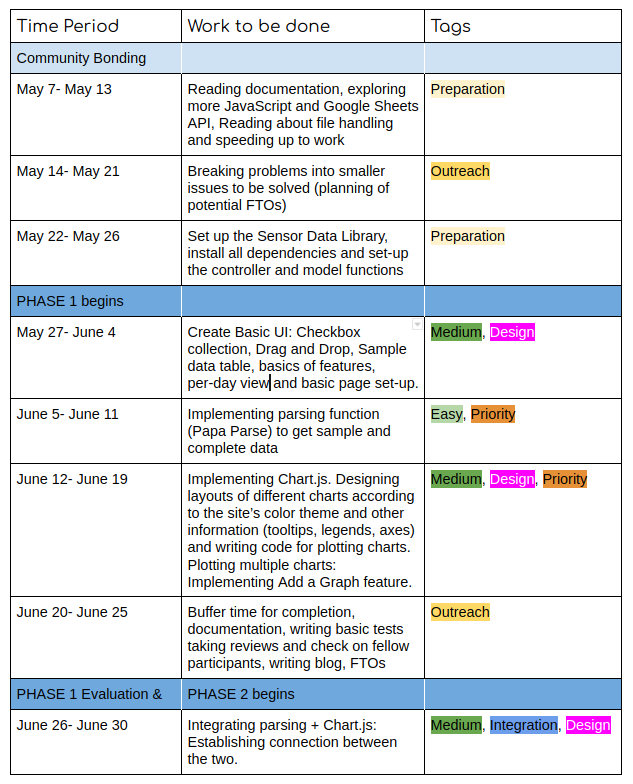
Timeline
Ps: At the end of each week, I'll be creating at least 2 FTOs to welcome new contributors!

Needs
I would be needing the guidance of mentors and I am open to any kind of help or input from other contributors.
Contributions to Public Lab
I have been actively contributing to Public Lab since December and I have worked on different types of issues, from minor to major and involving different aspects of the project (frontend and backend both). I am an active member of the community and have helped my fellow members with their issues and also opened many first-timers-only issues to welcome new contributors. I have also helped in reviewing and expanding the community during the peak time (https://publiclab.org/notes/gauravano/03-29-2019/software-community-growth-through-first-timers-only-issues) .
I have made about 20 commits to the plots2 repository and raised about 11 issues and I am well-versed with the codebase. I have also tried to expand MapKnitter to welcome new contributors and am in a discussion on some projects there as well.
I am working on some issues currently as well and hope to continue to do so!
Here are the issues reported by me:
https://github.com/publiclab/plots2/issues?utf8=%E2%9C%93&q=is%3Aissue+author%3AIshaGupta18
Here are my merged PRs:
Weekly-Check In opened by me:
https://github.com/publiclab/plots2/issues/4844
Some activity on Mapknitter: https://github.com/publiclab/mapknitter/issues?utf8=%E2%9C%93&q=is%3Aissue+involves%3AIshaGupta18+
Experience
I am a first-year undergrad pursuing CSE.
Being a part of the core team of Developer Student Club, through which I get to learn a lot about new and upcoming technologies, working together as a team towards finding solutions to real world problems and the experience of implementing and expanding my skill set to build things.
I started with basic JavaScript like creating a dragbox: https://github.com/IshaGupta18/dragbox
And a basic ping-pong game: https://github.com/IshaGupta18/ping-pong
Then I moved towards a little advanced JavaScript and learnt how to use AJAX and fetch data from APIs
https://github.com/IshaGupta18/JQueryAJAX
After this, I made a chatting engine in one of my Ruby on Rails projects using websockets for the users to chat in a common room:
https://github.com/IshaGupta18/my-connecti/tree/master/connecti-chat
I have worked with Ruby on Rails for about 7 months now, which I learned at Coding Ninjas (https://codingninjas.in/courses/classroom-web-development-course) , which has taught me Ruby on Rails from basic to advanced level so I am well-versed with the platform.
I started with some basic projects to become comfortable with Ruby first: https://github.com/IshaGupta18/Hangman-Ruby
Then I began creating some basic projects in Ruby on Rails to get an idea of the folder structure and the MVC structure:
https://github.com/IshaGupta18/basic-june
Then I learnt authentication with devise gem for user management:
https://github.com/IshaGupta18/devise-project
Finally, when I was thorough with the working of the platform, I created a bigger project, called connecti which is fully functional blogging engine with user authentication, oAuth, mails, many-to-many relationships between users, using AJAX for loading and also a JavaScript based chatting engine.
https://github.com/IshaGupta18/my-connecti
I am also comfortable with Data structures and algorithms and am fluent in C++, Java, and Python.
Apart from this, at the front end, I have worked with and confident in HTML, CSS and Bootstrap.
I made a basic resume landing page using HTML and CSS:
https://github.com/IshaGupta18/ResumeHTMLCSS
I am a member of the development club of my college, Byld where I get to organize and attend sessions about upcoming technologies.
In school, I was part of the cyber society, and have participated in numerous inter-school competitions.
Teamwork
Open Source is a place where people work together as a team even if people don't know each other that well or have never met. Running a project as a community shows how much we can do together, and how little we can do alone.
In open source, I began my journey with Public Lab which has shown me how powerful a community is and how helpful people are. During the initial stages when I was working to resolve my first issue and had so many doubts, I didn't feel hesitant or unwelcomed in seeking help, because people were always ready to help me. I felt immense joy when my first PR was merged and I knew I couldn't have done it without the community members.
I felt so motivated when I my peers helped me in merging my PRs and I felt so good in helping them by giving my best.
When I became more settled in the community, I felt that it was time to give it back to the community by welcoming newcomers, helping them create their first PRs and getting them merged and it felt terrific to see the community expanding.
Apart from this, I have worked in several group projects in my school and college, especially on IoT and on environmental projects in school called "Vasudha" (meaning Earth in English) every alternate year that dealt with a specific type of environmental problems like the issue of non-biodegradable poly bags, global warming, waste management etc. and required us to conduct surveys, analyze the results and propose solutions.
I feel motivated to resolve bugs and solve problems because that gives me a chance to use my skill set in making something productive. I have loved computers and working with them since I was little and nothing gives me more happiness than writing code for a community, where people share the same passion.
Passion
Today I see a lot of pollution in the city where I live and spent my childhood in, and it causes me so much distress, to see that the Average Air Quality index has risen to an alarming value of 296, which is responsible for causing so many diseases around me. The situation wasn't so bad when I was younger, and to see it change so drastically makes me very inclined towards Public Lab. Public lab interests me because of its research and development in the environmental field and the way everyone here is enthusiastic and determined to solve environmental problems. I feel that even if I am able to contribute a little towards this organization, it will be my first step towards helping create a cleaner picture and do more in this field. I am passionate about solving real-life problems, things that help people, even in the tiniest possible way.
Audience
Even in this fast moving world, there are people who still are not very comfortable with using computers to their best use. Through this project, I want to target the non-programmers in making use of the data they have and turning it into something more conclusive, useful and informative, with ease and without losing focus on their task and getting the analysis part done quicker.
Commitment
I completely understand that proceeding forward with this project and completing it is a very serious commitment and there are still a lot of things that need to be done in the project and I am really looking forward to exploring them and will be fully dedicated to completing it because I
am very excited in creating something new and useful and would be more than happy to work on it!
33 Comments
Hey, @warren @bansal_sidharth2996 this is my draft for GSoC'19 proposal. I have a lot more to do here, more designs and ideas to come in, but in the meanwhile, I would love to have your review on this! Thanks a lot!
Reply to this comment...
Log in to comment
Please pardon my formatting, I don't understand how that is happening.
Reply to this comment...
Log in to comment
Great proposal. I really love your workflow Isha.
Reply to this comment...
Log in to comment
Please include some time for fto, bugs and documentation in the timeline.
Reply to this comment...
Log in to comment
Thanks a lot @bansal_sidharth2996 ! I have kept the last week ie 18th to 24th August for that only. I could include some time for FTOs in the middle of the period, around Phase 2 I guess?
Is this a question? Click here to post it to the Questions page.
Reply to this comment...
Log in to comment
Hi, Isha! There's a lot here, thank you, what a deeply thought-out proposal!
I have a few suggestions for starters -- first, what if we made this a pure JS library? So we basically handle CSVs as we do currently, which is that you can drag them in, and they display a graph. But all the code could be in JS to be run on the CSV in the browser! We could save the state (i.e. the choice of graph type, default time bounds, etc) in a string, kind of like an inline power tag: https://publiclab.org/n/15582
OR we could store the settings in the URL, as we do in Image Sequencer: https://sequencer.publiclab.org/examples/#steps=ndvi,colormap
This would modularize a lot of code away from the back-end in a clean way, and the library could be usable by other projects as well. What do you think?
Is this a question? Click here to post it to the Questions page.
Reply to this comment...
Log in to comment
Thanks a lot @warren! I actually thought a lot about this, but then I realized that CSV files are quite big and heavy and parsing them on the front-end, at the client side would put an unnecessary load on the clients browser. So a heavy task like this could be handled very easily by the server. Besides, we would be needing to write the file-user logic there only, so this could be handled together with it. I am open to doing what you suggested as well. What do you think?
Is this a question? Click here to post it to the Questions page.
Reply to this comment...
Log in to comment
Isha please read the guidelines for Gsoc and outreachy applications. There are a conditional way by which you can participate in both program one after other or attempt only one of both of them through the life. Choose your decision wisely. We are open for both programs.
Reply to this comment...
Log in to comment
Yes @bansal_sidharth2996 absolutely! Will definitely do so!
Reply to this comment...
Log in to comment
Hi @IshaGupta18 ! Very nice and complete proposal, congratulations! Depending on what happens, I would be glad to help you out as a mentor. The part of adding a Browsable Time Slider is very cool. About what @warren said, I believe making it a pure JS library might be interesting because of the potential reusability, perhaps integrating it with Image Sequencer, the Editor and others in the future. As you mentioned, it might be a quite heavy task, but as far as I know currently we don't have much trouble with excessive load on client-side. If it happens, we can always move it to the server-side with few changes. That said, I think both implementations can be equally successful. Thanks!
Reply to this comment...
Log in to comment
Thanks a lot @IgorWilbert Yes I think you are right, we can explore more on this. When I saw PL Editor's code, it was very well written however a lot of it involved using plots2, so I thought that we could make good use of plots2 here, by putting the load on the server. But I am very open to exploring the client side strategy as well, since there are some good CSV parsing JS libraries as well!
Reply to this comment...
Log in to comment
Parsing the CSV on the Server side is not a good idea. Suppose there are 100 or 500 or more users who are using this new feature at a time. Then parsing of these 100csv would make lots of loads on the server instead we have a distributed load on the client computers in the client side. And also this will not only create load on the server but it will also have delay response to the user. Let suppose there are 500 users who have submitted the parsing request simultaneously then the last csv's user has to wait for all the csv to parse which will cause in the delay in response. Also, we should not depend upon the rails for it. We should build a standard independent js library which can directly be included in any project via CDN or npm modules or yarn. And can be just activated by using id of div and calling a function.
Reply to this comment...
Log in to comment
I still have some questions on this. Whether it is a good idea to do the heavy lifting of parsing on the user's CPU or it could be well-managed by the server or not. The file will have to be submitted through a form and saved to be displayed in per-user data, that can be done asynchronously as well, so that shouldn't pose as a problem. A problem that could come up, is if the library is not able to handle the file's format ie there are errors in parsing, there will be difficulty in reporting them. But at the server side, something like Sentry can be used to get the logs and fix the errors. So could you please give your points of view on this so that we can find the best possible solution to the problem? Thanks a lot!
Is this a question? Click here to post it to the Questions page.
Reply to this comment...
Log in to comment
Just by way of context, in general, we try to develop lots of sub-libraries in pure JavaScript, like these:
https://github.com/publiclab/leaflet-environmental-layers/ https://github.com/publiclab/Leaflet.BlurredLocation https://github.com/publiclab/inline-markdown-editor https://github.com/publiclab/PublicLab.Editor
This is so that they are more self-contained, maintainable, and have less JS/Ruby mixing. This is a good model and you might look closely at these examples!
Reply to this comment...
Log in to comment
There are definitely advantages to server-side programs. But we've found that making lightweight, clearly documented mini-libraries for different purposes can really make for good maintainable code, and after all, we don't really want PublicLab.org's codebase to start growing to encompass all possible uses. We've felt it's better to think of it as the platform and each of these libraries as a kind of "app" running on it. Does that make sense?
Is this a question? Click here to post it to the Questions page.
Reply to this comment...
Log in to comment
Agreed, I think it makes sense to make the library modular.
Reply to this comment...
Log in to comment
Okay so I have made some major changes, especially in the flow of parsing at the front end instead of at the backend, apart from adding some new features. Please review and let me know what else can be done and improved. Thanks a lot @warren @bansal_sidharth2996 @IgorWilbert.
Reply to this comment...
Log in to comment
Hi @IshaGupta18 ! This is really amazing proposal , very detailed 🙌 !
You have taken care of all the nitty-gritty to make this project successful . Congratulations 😃 !
Reply to this comment...
Log in to comment
Thanks a lot @sagarpreet! I am glad you liked it!
Reply to this comment...
Log in to comment
@IshaGupta18 Whoa! So detailed yet exact! Going through this was a treat!! 😃
Congratulations!! 👍
Reply to this comment...
Log in to comment
Thanks a lot @rexagod! Happy to hear your kind words!
Reply to this comment...
Log in to comment
@warren @bansal_sidharth2996 @gauravano @souravirus @IgorWilbert I have updated my proposal and have made some important changes to it in terms of code, features and design. Kindly have a look at it and please give your review. Any feedback is welcome. Thanks a lot!
Reply to this comment...
Log in to comment
Hi @IshaGupta18. This is a really nice and detailed proposal. Really nice work. Thank You !!
Reply to this comment...
Log in to comment
Thanks a lot for your review @souravirus!
Reply to this comment...
Log in to comment
Hi @ishaGupta18!!! Thanks for all your hard work. I'll go through a bit now and will add more later!
First, I think for a lot of this, it may be sufficient to just stick to line graphs for the time being. That can simplify your project, at least in the first version!
Also, one juncture where you may want to split your work is where you upload the file, then run stuff on it, versus in some cases, where the file will already be online, and you just need to load it from a URL. If you think of your library as accepting input in 2 formats, you could have the rest of the library share code, so one might be
$('.dropzone').onDrop(function(file) { new yourCsvLibrary(file); });(or something like that) or it might be simpler, likenew yourCsvLibrary(urlToCsv)Make sense?
I love how you're thinking of auto-recognizing columns. There might be a couple lines where we have to prompt:
Select a column for labeling your graph: [select +]Select a column for time: [select +]That said, for /some/ CSVs we could try to auto-detect which is full of timestamps... worth a try!
For time slider, try this interface out, it's pretty nice: https://oss.skylight.io/app/applications/GZDPChmcfm1Q/recent/6h/endpoints
And I believe there are lots of time slider plugins and libraries out there -- the existing really minimal graphing on PL uses Chart.js - https://publiclab.org/wiki/power-tags#Inline+graphs -- are there timeline scrolling plugins for that? (update: you're way ahead of me!!! i see you found https://github.com/schme16/Chart.js-RangeSlider/)
One alternative view might be interesting -- a view by day, so you can see if something you are sensing for (like #purple-air dust sensing) happens at the same time each day. You might see a spike on multiple graphs because a truck goes by at the same time each day. Interesting to try looking for patterns!
I like this a lot. Some libraries like the one @cess used on https://publiclab.org/stats allow downloading automatically.
OK, thinking on the mailer - i wonder if it could be simpler but more powerful to prompt people to post their work as a "note" on https://publiclab.org -- because then it'd be published online, they could add a blog post around it, and people could comment on it and discuss. This already then sends email updates to people who are subscribed, so it nicely re-uses existing infrastructure!
On that theme, if you drag a CSV into https://publiclab.org/post now, you should get a short-code that shows a graph when you publish - documented at https://publiclab.org/wiki/power-tags#Inline+graphs -- so, i wonder if we really need a new table/model for it. Could we keep using the Image model, and just detect based on file type which are images and which are CSVs? What are the pros/cons here -- less to maintain, maybe, but more confusing if CSVs share a lot of systems with Images? Still, at a basic level it already works, which could free up time for you to work on other parts of this large and ambitious proposal.
Thanks so much for your hard work on this. Your mockups and design work are tremendous! 🎉 👍
Is this a question? Click here to post it to the Questions page.
Reply to this comment...
Log in to comment
Thanks a lot, @warren for your deep analysis and review! Firstly, I would like to say, different types of graphs is not a problem at all, as they are just types and can be easily passed along with columns. Secondly, yes the code can split two ways according to the file being used: previously uploaded and currently uploaded I think we can definitely do the labeling thing because this way we can display a correct title and proper axis names according to the user. I was also thinking of adding a small text box where the user can describe the type of data he/she has uploaded so that this can be used a short description in displaying per-user data, or elsewhere like the note creation. What do you think? As I mentioned, I will be redesigning the time-slider, but now I will try to keep it more minimalistic.] And yes, we could add an option to plot data day by day, we could take this information as an input and plot a separate graph for each day by iteration over the x-axis column (those many separate graphs) I think we can implement publishing the plots as a research note feature. That would promote reusability and the data can actually be saved like this. Although, I also feel that we should not get rid of the mail report feature, because this mail will not be sending an update but sending the plot and exported CSV as encapsulated data, which the user can use to print or to forward to colleagues. What do you think? And yes, I did have a look at the current CSV upload thing while doing my research however I felt it might be a little confusing to use that directly here, as a lot of other stuff is being done with the uploaded CSV files and keeping track might get a little harder. However, I will look into its code more deeply and will see how it can be reused. Thanks again for all the insight, I will get back to you ASAP with the suggested changes!
Is this a question? Click here to post it to the Questions page.
Reply to this comment...
Log in to comment
Hey, @warren I have updated my proposal according to the changes you suggested. Please have a look at them in case you get the time! Thanks a lot!
Reply to this comment...
Log in to comment
Hi, please upload your proposal at the Google Summer of Code website at the earliest. Please ignore this comment if already done.
Reply to this comment...
Log in to comment
Hi @ishaGupta18! I wanted to be sure you and @namangupta connect about the shared parts of your project. I think it's worth also connecting with @rexagod and @sagarpreet and looking at how simple libraries may be set up in their own repositories, that later integrate with the main
plots2codebase. This way, your code would be more self-contained, and a demo could live at thegh-pagesbranch, just like in some of the libraries i mentioned above. You could republish it to demo your work as often as you like.Also, both you and Naman should look at http://webjack.io, which is a neat library for collecting data from a sensor. We could even send you both a simple sensor to be plugged in in this way, so that you can have the experience of collecting and uploading data and think about the process holistically. If you'd like, please send your mailing addresses to: kits@publiclab.org and quote this paragraph here in your email! Thanks!
Reply to this comment...
Log in to comment
Actually, @sidntrivedi012 will also be working on a stand-alone library that plugs into a Rails app -- Spectral Workbench Capture! So, this is a good group to get connected with as well.
Reply to this comment...
Log in to comment
And finally, I want to encourage you both to try building a completely bare-bones system first; don't sweat about the styling, the different graph types, for the very first prototype.
This is just an overall sketch of how you might approach this. But you've already done a lot of planning, so you're well prepared for this!
Reply to this comment...
Log in to comment
I guess I'm saying in particular that moving the integration-with-plots2 step later in your schedule may help your code be more independent and self-contained, you know? And that hosting a demo on
gh-pagesis a way to publish your work even before then!Is this a question? Click here to post it to the Questions page.
Reply to this comment...
Log in to comment
Oh wow, thank you so much for the ideas and support. We would definitely follow the best approach in building the library and get in touch with @rexagod and @sagarpreet for their suggestions on the same. I agree with you in moving the integration parts a little late in the timeline, that way we will be surer of what is that we want from plots2 and build a skeletal but functional system for starters. Thank you so much for offering us a sensor and we will definitely email you when we want to try it out, I have an Arduino kit at home anyways! Thanks a ton again!
Reply to this comment...
Log in to comment
Login to comment.