Calculus involves the study of rates of change and areas under the curves generated by functions. Before the mathematics for calculus was developed to the point of being able to reliably find the area under curves of functions geometric methods where used to find the area of irregular shapes and functions. These methods pick a shape of a known well defined area and fill the area to be approximated with that shape and calculate the area of all of the shapes generated to fill the curve. Which can also be applied to spectral data with a spreadsheet editing program to find the area under spectral curves.
Important things to note:
- In excel starter or similar spreadsheet program the spectra "function" will have wavelength as a series of x values and intensity as a series of y values which will be used to describe geometric features of the shapes used in the approximation given by a .csv of the spectra.
- Spectral data is not a function that has a knowable equation to describe it. However it still appears to be relationship of discrete sets.
- The approximation accuracy is dependent on the change in values along the x axis (smaller is better) for non discrete functions. Actual integrals allow for the shapes to become infinitely small for an exact area of a function. However spreadsheet software might actually use a similar method to generate the curvature between points and might be a perfect fit.
- The following area formulas will be used for a triangle A = (1/2)*b*H and a rectangle A = L*W
- The area can only be calculated from at least one data point to another data point
- Only two values from the spectral data are shown here in the example real data sets will have tons of data point from X₁ to Xn for n pieces of data later in excel subscripts will be handled coordinates in the spreadsheet and a formula.
The shape that will be used is a trapezoid specifically this trapezoid:
where the X₁ is the first data point and X₂ is the second data point with their corresponding y values with some lines drawn in between to form shapes to used to find the area from one point to another.
Only two values from the spectral data are shown here real data sets will have tons of data point from X₁ to Xn for n pieces of data later in excel subscripts will be handled coordinates in the spreadsheet.
The area under the curve is approximated by adding the area of triangle to the area of the rectangle as pieces of the above trapezoid projected between data points of spectral data.
Calculating the lengths required to calculate the areas:
X₁ and X₂ are some distance along the x axis to get the length of X₁ to X₂ which is the total length from 0 to X₂ minus the length from 0 to X₁ so b = X₂-X₁ and W = X₂-X₁ and L being the length Y1 - 0 which is a distance along the y axis so L = Y1 and H is the difference of Y2 and Y1 so H = Y2 - Y1 .
Calculating the area:
Area of Triangle =  =
= 
Area of Rectangle = L*W = 
Total area = Area of Triangle + Area of Rectangle =

factoring out (X₂-X₁)
leads to

combining fractions leads to

This final expression is the approximate area between two adjacent point from left to right
Which is a nice expression written in terms of spectral data but how often is the only area you want to integrate in between only two adjacent points of data?
Many spectra peaks are broad and can occur over large section of points along the x axis and will not be captured. In order to get the area over a larger area you also want the previous area of the previous set of data points. This is because this formula only gets the area between adjacent points of data.

The picture shows a default area of 0 for the first area data point and the formula developed above underlined with red and a previous area value underlined with yellow. So the formula calculates the area between point the formula is in and the previous value and at the end the previous area is also added to this result. So any value in the Area column is the area under the curve from 400.01nm to what ever row the value is calculated for.
To integrate specific peaks it is helpful to look a graph of your spectra to identify peaks

To get the area under the curve peak wavelength ranges Take the accumulated area value at the larger wavelength and subtract the smaller wavelength accumulated area.

This picture shows the formula of subtracted areas to get specific peak areas.
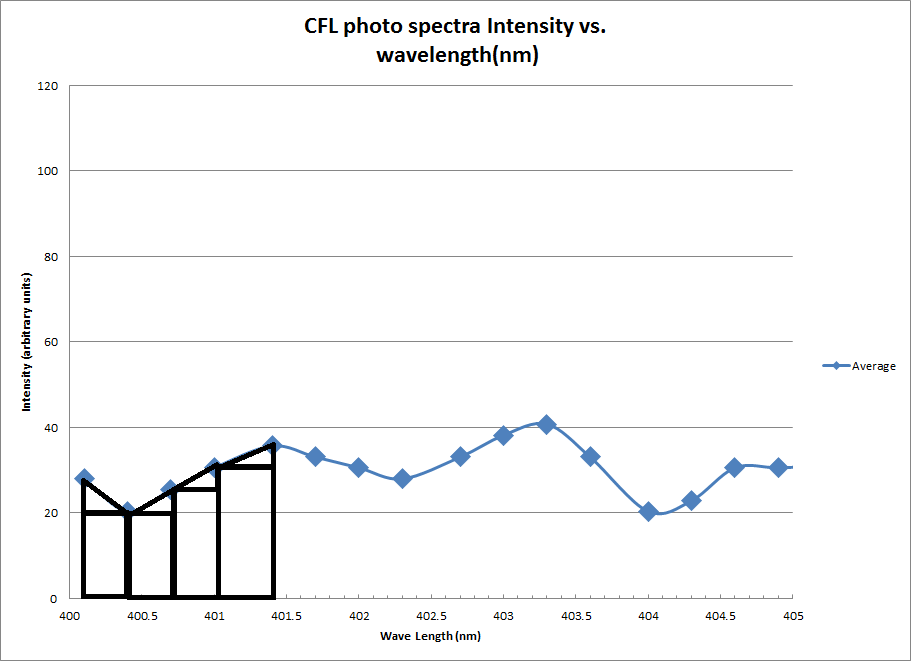
How the trapezoids fill the curve as drawn from paint in an extremely zoomed spectra

To show this is equivalent to an actual integration over a line between individual points let their be a line defined by any two adjacent points in the data set using the generic formula for a line. Where n is a specific data point from a list of data points where n = 1 is the first data point incrementing by one for each data point so the second point is n = 2 and so on.

where m and b can be solved using for by using two adjacent data points in this case
In this case the points  and
and  so the slope(m) is the difference between points

so b can be solved for algebraically after plugging in the same points to the formula for a line

solving and simplifying for b results in

giving the line in between these adjacent data points

Which will now be integrated over the interval 

Which evaluates to
Needs conclusion and edits
0 Comments
Login to comment.