If you have a solution of unknown concentration -- for example, a water sample that's greenish or brownish -- you can compare it to two samples whose concentration you do know to calculate the unknown one. This lets you measure not what something is, but how much of it there is in a sample.
This activity is not yet complete -- it's under development. Please offer comments/feedback/questions! But I'll be updating it over the next few days. Thanks!
(this is based on several other activities - see #beers-law, and in its most basic form, this works without a spectrometer too!)
Finally, note that you may get more consistent results with a more rigid setup, such as with the Lego Spectrometer.

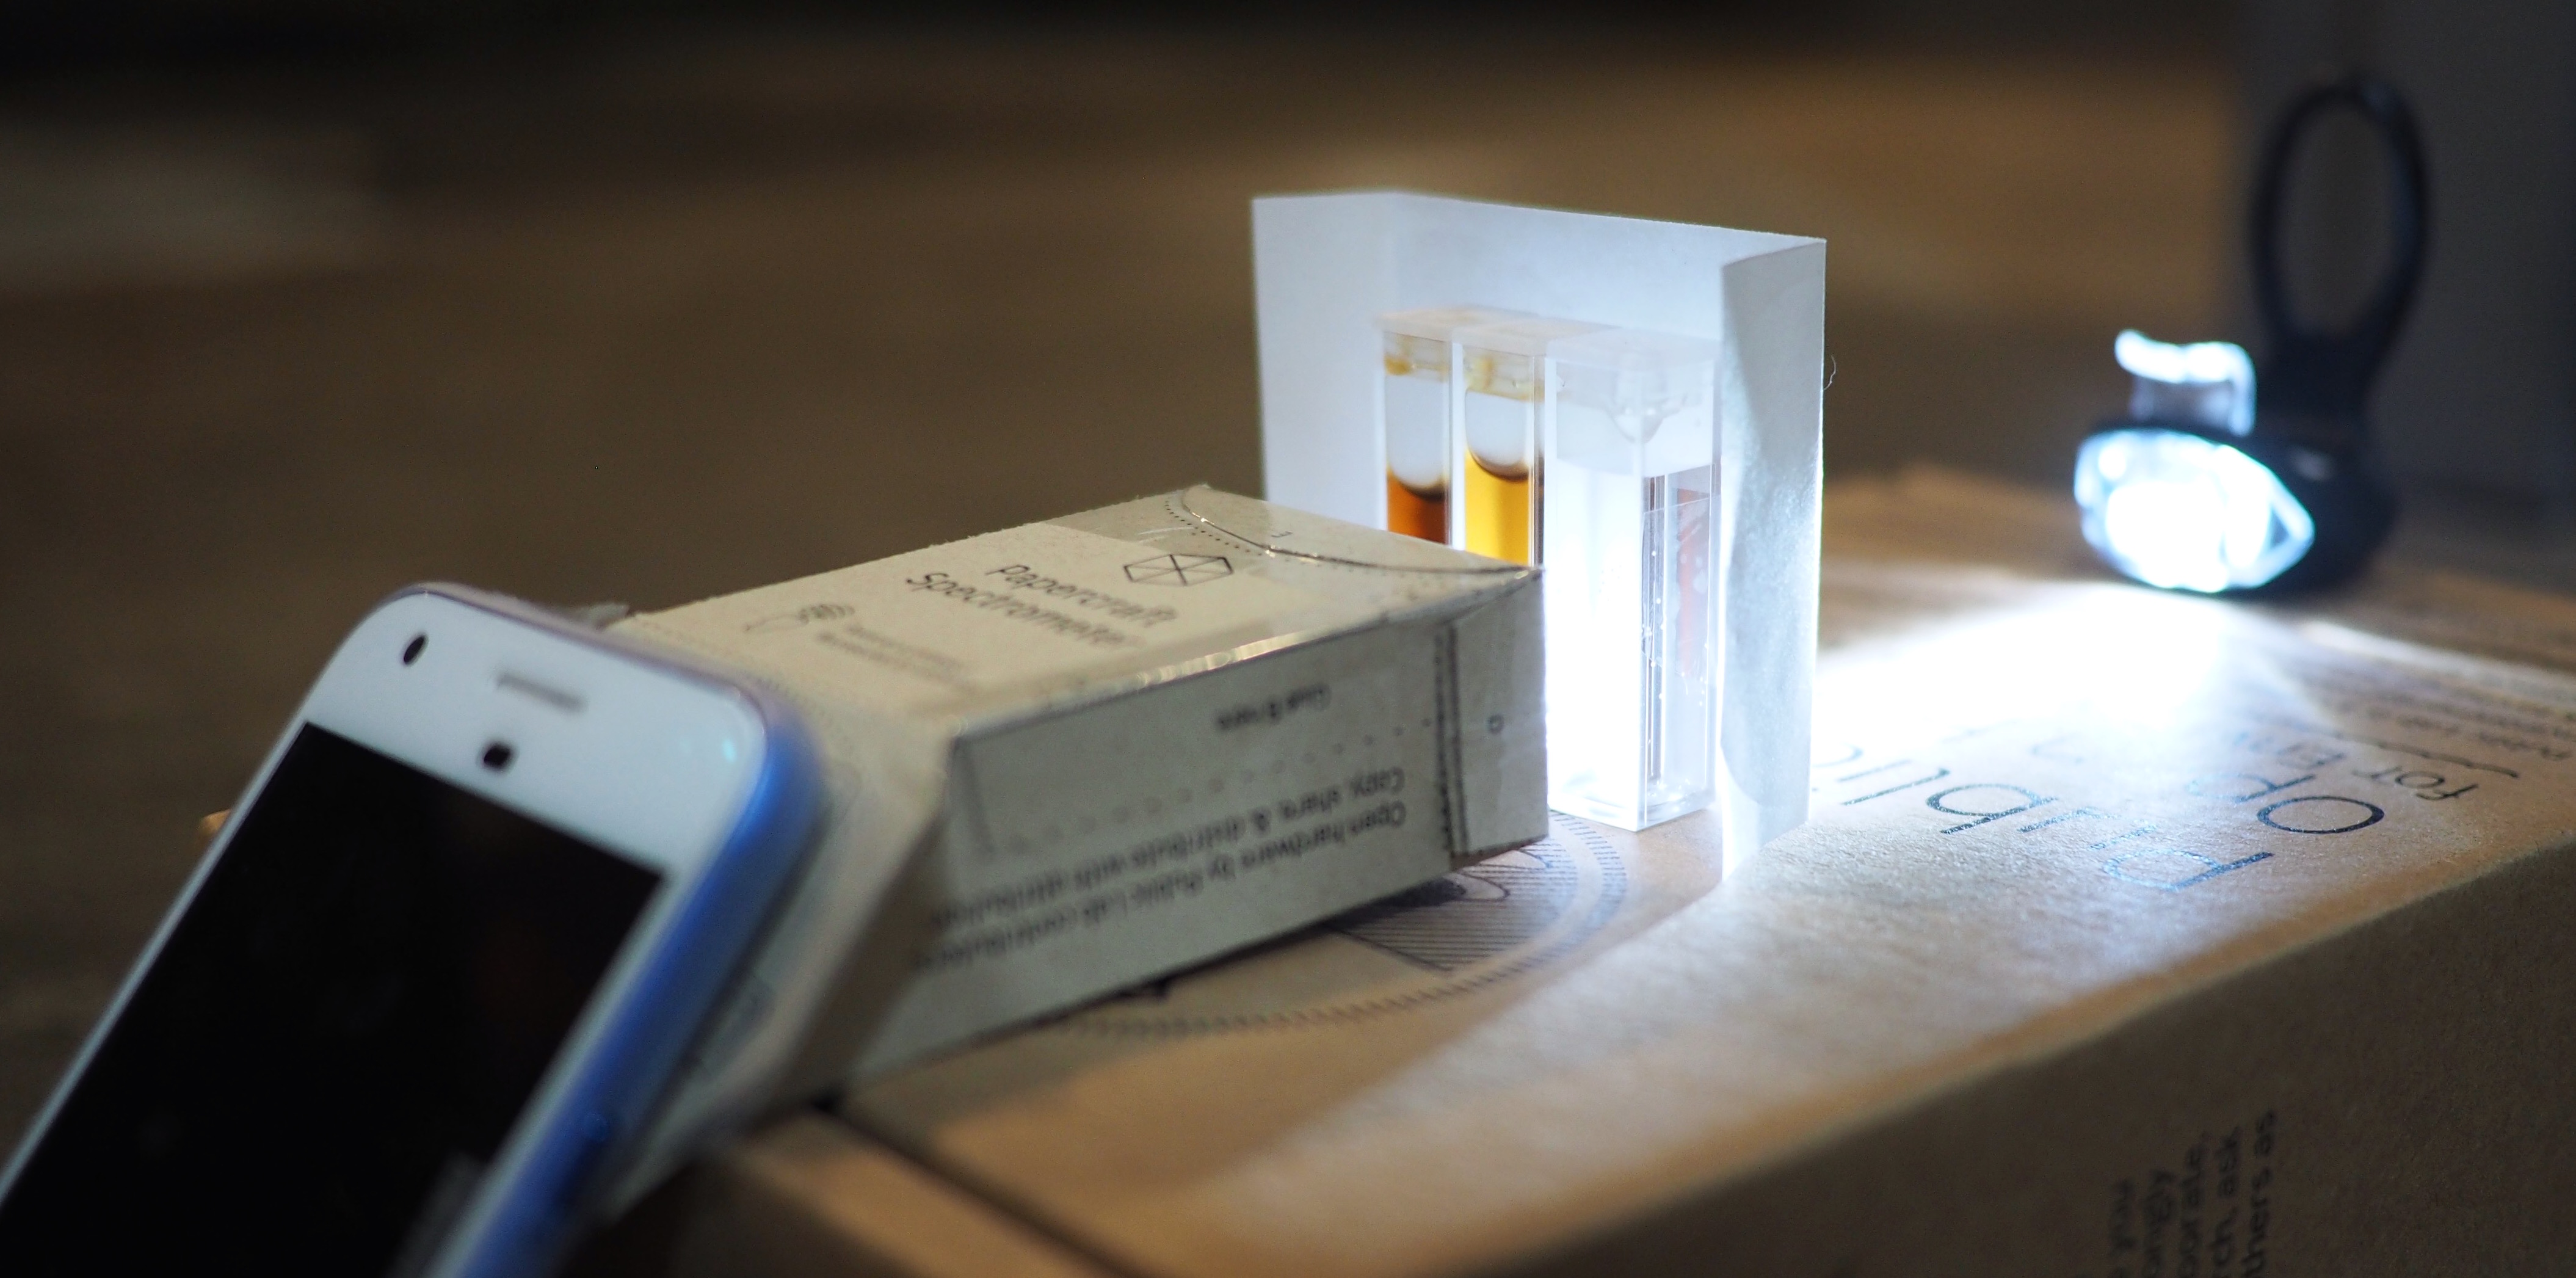
In this picture, the right sample has 1 gram of instant coffee crystals added to it, and the left sample is pure water, so a concentration of zero. The middle has an "unknown" amount of coffee crystals in it -- I use quotation marks because I actually know, but I won't reveal this until the end.
All we know from looking at the center it is that it's less concentrated than the right sample, and more concentrated than pure water. But to take that further, by measuring how opaque it is with the spectrometer, we can determine precisely how much coffee is in the middle. Note that this should work with any coloring -- food coloring, or muddy (turbid) water from a river.
Prerequisites
To do this test, you'll need a spectrometer, and to know how to save data with it, for example on Spectral Workbench. The following resources can help you get ready -- then come back here to complete this activity:
| Purpose | Category | Status | Author | Time | Difficulty | Replications |
|---|---|---|---|---|---|---|
| Build a papercraft spectrometer for your phone -- version 2.0 | - | - | @warren | - | - | 2 replications: Try it » |
| Calibrate your spectrometer in Spectral Workbench | verify | review-me | @warren | 15m | easy | 5 replications: Try it » |
| Assemble a DIY Papercraft Spectrometer | build | complete | @abdul | 10min | introductory | 3 replications: Try it » |
| Reduce light inside foldable PL spectrometer | - | - | @xose | - | - | 0 replications: Try it » |
| Scan and compare different gases (in discharge tubes, like neon) using a DIY spectrometer | - | - | @warren | - | - | 27 replications: Try it » |
| Make a narrow slit for a DIY spectrometer out of paper | - | - | @warren | - | - | 0 replications: Try it » |
| See the Fraunhofer absorption lines in sunlight | verify | draft | @warren | 1h | easy | 4 replications: Try it » |
| Draft: Find the concentration of a liquid with a DIY spectrometer | - | - | @warren | - | - | 0 replications: Try it » |
Activities should include a materials list, costs and a step-by-step guide to construction with photos. Learn what makes a good activity here.
Setup
To do this test yourself, you'll need:
- a spectrometer -- this shows a simple papercraft one, but a more rigid one like the Desktop Spectrometry Starter Kit will be even better
- three test tubes, cuvettes, or other narrow sample containers (tic tac containers can work!)
- clean water
- something to dilute into the water - soda, for example, or coffee
- a broad-spectrum light source - a halogen, incandescent, or xenon lamp, or the sun (a white LED will work all right, but is less ideal because the red, green, and blue colors aren't as well mixed as others. Fluorescent lights even less so.)
- a dark room

Here, see smartphone and spectrometer to the left, then the cuvettes holding the samples, then a thin piece of white paper to diffuse the light, then a strong LED bicycle light. Note that this is not a very stable setup! More on this below.
_
_
Stability
For repeated measurements to be consistent, it's very important that your setup remain stable. If you're using a paper spectrometer, consider affixing the parts in a rigid box, and reinforcing it with more structural supports so that each time you scan, the angles and dimensions remain the same. In my photo above, I haven't done this, so my data may not be very consistent, but I wanted to show the whole setup photogenically. I recommend gluing things down inside a rigid box for your tests, and not moving your phone for the duration of your work.
Lighting consistency
Notice added a thin piece of white paper to try to ensure that all three samples are evenly lit. If one gets less light, we might get a falsely low reading from it.
Prepare samples for scanning
When you collect samples, you can use a glass jar -- see Sampling for more resources on this. But for scanning, you need to carefully prepare each sample consistently. I used an eyedropper to fill one with pure water, but weighed the instant coffee crystals before adding them.
If you're using a reagent, the "positive control" -- the one with a known amount of what you're looking for -- would be the one on the right in this picture, and you'd add the same amount of reagent to each container. But in this case, I'm just measuring how much coffee is in each, rather than the color change of a reagent.

Scan the samples
We'll be scanning all three samples at once, which will help ensure the lighting conditions don't change when we make our comparison. Here, see the three distinct vertical bands corresponding to the opaque, medium, and clear samples.
Scanning all together is seeing some difficulties -- the light seems strongest at the center, so that throws the results. See comments for more as this activity comes together, and also check out Can a DIY spectrometer be used to measure water turbidity? and What's an easy way to compare two liquid samples with a spectrometer?

Upload your spectrum to SpectralWorkbench.org three times -- one for each sample -- and save them as a set.
(For added confidence, try comparing three scans of the same sample, to ensure that your data is consistent.)
Once you've saved three copies, open one and look at your spectrum's graph. You should see three distinct areas of your spectrum -- one for each sample.
Using the tool, choose a cross section that intersects your first sample, the pure water. Title the spectrum "Water".
Repeat this for your other 2 samples, labeling each.
Note: we'll need to address the curvature of the spectrum.
Calculate the concentration
Looking at the collection of three spectra,
Choose a wavelength to make your comparison. Does the intensity vary most at a particular color? That may be the best point at which to sample; see Selecting the Abosrbance Wavelength in @straylight's post here: https://publiclab.org/notes/straylight/05-13-2013/using-the-spectroscope-for-analysis-of-concentration-beer-s-law
So, for each...
(more soon)
[graph here]
Next steps
Once you've tested this out with a known sample, try it with river water, or something else unknown.
3 Comments
I think the light is not evenly distributed, and in the scan I took, there's just more light in the middle. I'd like to correct for this but it's either:
More testing needed...
Reply to this comment...
Log in to comment
Hi Warren I'm also working on a beers law based machine for testing one cuvette at a time and measuring the amount of light penetrating through the sample. Now I know i'm kinda new to this group but do you think adding an arduino to a project would be to complex ? I wanted to increase the resolution and data being delivered so I added a GA1A12S202 Log-scale Analog Light Sensor and this requires an Arduino and a small amount of coding that I would of course provide when I publish this design. This circuit only has 3 wires to connect and can be done by most people I just wanted to throw the idea at someone that has more experience with Public Lab Members. Ohh and here are some photos of the light sensor and the machine I have designed.
Thanks Zachary Marlow
Is this a question? Click here to post it to the Questions page.
Reply to this comment...
Log in to comment
OK, my next thought on this would be to scan 2 at once instead of 3, so that at least any non-evenness would be symmetric horizontally. But I'm not sure exactly -- should I then take 2 scans, one comparing the original against the blank, and the other comparing against the positive control?
Is this a question? Click here to post it to the Questions page.
Reply to this comment...
Log in to comment
Login to comment.