Goal:
the goal is to read and save the raw output of a Shinyei PPD42 particle sensor to a local storage on a Raspberry Pi and out to the internet through the Open Pipe Kit. Later on, we'll be trying to translate the raw sensor data to standard presentation formats in um/m3. We want to make that conversion as transparent as possible so that calibrations or modifications to the raw count can be applied retroactively.
the driver is being worked on in this Github repository.
the Raw data:
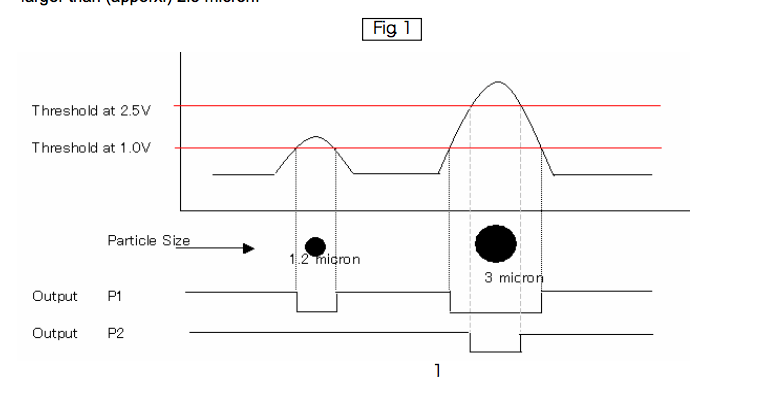
The data coming out of an Shinyei PPD42 optical sensor is raw count of a particle size cutoff as the particles transit the optical sensor.

as particles transit, they generate a signal in the photodiode. A circuit reads this signal looking for spikes correlated with larger particles.

Output P1 is all particles above 1.2um and output P2 is all particles bigger than 2.5um. output P2 therefore contains P1. These two outputs are designed to be roughly equivalent to PM2.5 and PM10 particle sizes.
sampling the sensor
Shinyei recommends sampling the sensor by measuring the % of time that particles are transiting the sensor averaged over 30 seconds, for P1 and P2 individually.

Shinyei's documents: Size_Discrimination(PPD42NJ).pdf
Spec_PPD42NJ_Eng_SPP13001V00_20130319.pdf
the software strategy:
The goal is to make the data flow as flexible as possible. We’ll be using an Arduino-based device for PWM sampling of the sensor, bridging using Firmata to communicate with a Raspberry Pi running Open Pipe Kit.
On the ‘Pi / OPK
Firmata.js will be used to sample the sensors and send on to OPK, which will store the raw particle count, length of time of count, and timestamp for count start, calculated PM2.5/PM10 equivalences, and a record of the equivalence calculation.
Further work: the desired format
we want individual particle counts that correspond to EPA’s PM2.5 and PM10 standards. those standards are based on tools that differentiate between particles by separating them based on their drop in flight, and then weighing collected particles. our real-time monitor can’t do that, so we’re going to try to calculate an equivalence between Optical particle counts equivalence to the ug/m3 (of air) format of PM standards. that estimation is based on a calculation of equivalency between the albedo (brightness) and transit of a particle across an optical sensor and the “mass mean aerodynamic diameter,” which is a way of saying particles that fall through the air at the same rate as a perfect sphere of 10um or 2.5um. This will always be a little fuzzy.
To quote @DavidMack: The EPA definition of PM fractions can be found in 40 CFR Part 50, seehttp://www.ecfr.gov/cgi-bin/text-idx?tpl=/ecfrbrowse/Title40/40cfr50_main_02.tpl "particulate matter shall be measured in the ambient air as PM10 (particles with an aerodynamic diameter LESS THAN OR EQUAL to a nominal 10 micrometers)" and PM2.5 is a "LESS THAN OR EQUAL to a nominal 2.5 micrometers" The 50% cut point refers to the EFFICIENCY at which particles are removed by the selective inlet at the given size. So for PM10, the inlet removes 50% of particles at 10 microns but above 10 microns the removal efficiency increases and below 10 microns removal efficiency declines. Thus the resultant fraction is not a normal distribution (e.g. 50% above and 50% below) but a skewed distribution (see graph below). Also, the rate at which removal efficiency changes is referred to as the cut point SHARPNESS.

14 Comments
@mathew sez:
Node.js interface for the Speck: https://github.com/CMU-CREATE-Lab/node-speck-sensor
node.js interface for SHT15 on Raspberry Pi https://github.com/keito/pi-sht1x
python interface for capturing serial output of the dylos monitor (this is the best one I could find but there are 11 dylos projects on github) https://github.com/louwrentius/airquality
alternate for Speck https://github.com/CMU-CREATE-Lab/node-speck-gateway
Reply to this comment...
Log in to comment
So, today I wrote an OPK driver using the Firmata Node library to access an Arduino over the Firmata firmware, but we discovered that the Shinyei needs us to work fast enough (if we're understanding properly) to actually measure individual particles passing the sensor -- which can take 10-90ms. Node and the USB interface just can't work fast enough, as we understand it -- I was getting notices that even a 10ms interval was not completing digitalReads fast enough.
So we're going to switch back to doing it on the Arduino, and my driver will adapt to just reading the sums reported by the Arduino.
BUT! (@rjstatic and @donblair - this may be of interest) This driver (https://github.com/jywarren/opk-shinyei-ppd42-cli) is a great example on which to base a generalized Firmata/Arduino driver. Basically, if you can plug a sensor into an Arduino (say, a $9 Arduino-compatible Digispark), you'd be able to connect it to Open Pipe Kit. Some more flags to the command line interface can let us specify which pins to poll.
It won't work for superfast sensors like the Shinyei -- the latency requirements are too great -- but for many many other sensors, this works great.
Reply to this comment...
Log in to comment
Finishd the OPK Firmata CLI for one-pin readings: https://github.com/jywarren/opk-firmata-cli/
@rjstatic and @donblair - pretty useful; basically anything you can plug into an Arduino you can now plug into OPK, I think? Might be good to add:
Is this a question? Click here to post it to the Questions page.
Reply to this comment...
Log in to comment
Here's some data from the Shinyei. We're still interpreting this: https://gist.github.com/jywarren/54453678f43a2c555f64
Reply to this comment...
Log in to comment
We now have live graphs from it -- looking good!
Reply to this comment...
Log in to comment
Mathew also did some good research on the ThermoFisher PDR-1500 http://www.thermoscientific.com/en/product/i-personal-i-dataram-pdr-1500-aerosol-monitor.html :
manual: http://www.geotechenv.com/Manuals/Thermo_Scientific_Manuals/thermo_pdr-1500_manual.pdf
we need to communicate with the pDR-1500 through UART serial, but it has a built-in serial to USB bridge, the Silicon Laboratories CP2102 this device runs at 19200 (page B-1) USB drivers are here and in the linux kernel. https://www.silabs.com/products/mcu/Pages/USBtoUARTBridgeVCPDrivers.aspx
Before running the device must be zeroed
OUTPUT (or OUT or O) [conc or scat] [temp (C)] [RH (%)] [Pa (mmHg)] Returns the current values of the concentrations, temperature, RH and atmospheric pressure if the pDR-1500 is running.
LOGPERIOD [seconds] Returns, or programs, the logging period in seconds.
SD [Status] Returns, or programs, the streaming data status. Status = {“enabled” or “on”, “disabled” or “off”}
this function is unexplained we don’t know that it does.
CALFACTOR [float value] Returns, or programs, the user calibration adjustment factor. The value can range from 0.001 to 10.000.
RHCORRECT [status] Returns, or programs, the status of Relative Humidity correction to the computation of mass concentration. Status = {“disable” or “off”, “enable” or “on”}
DATE [day] [month] [year] Returns, or programs, the date in the RTC. Day, month and year are all integer values.
TIME [seconds] [minutes] [hours] Returns, or programs, the RTC’s current time.
FLOWRATE [flow rate] Returns, or programs, the flow rate [LPM] that is to be maintained. This cannot be changed while logging. Flow rate = {1.00, 1.01, 1.02, …, 3.50} [in LPM]
TEMP [temp] [RH] [Pa] Get current temperature, RH and atmospheric pressure. temp is in degrees Celsius RH is Relative Humidity in percent Pa is barometric pressure in mmHG
UNITS [integer] the current measurement units: Units = 0 = μg/m3 (Mass concentration) 1 = 1/Mm (880 nm scattering coefficient)
INLET [integer] Returns, or programs, the inlet selection from the choices integer = {0, 1, 2} 0 = TOTAL 1 = CYCLONE RED (PM 10) 2 = CYCLONE BLUE (PM 2.5)
SITE [site #] Returns, or programs, the description of site number sitenum. Sites are numbered 1–50. sites can have their own corrections, but these corrections may be better done on the server?
Is this a question? Click here to post it to the Questions page.
Reply to this comment...
Log in to comment
Thermofisher working! https://github.com/jywarren/opk-thermofisher-pdr1500-cli and https://data.sparkfun.com/streams/g6Gn19yp9yU6WaObjlYO
Leaving them both running on a 30 second cycle, next to one another.
Reply to this comment...
Log in to comment
And over a longer period -- 2/3 of the way through, i lit a piece of paper on fire.
Reply to this comment...
Log in to comment
Note that I did not zero out the TF, and the vertical scales are wrong. Just very very early testing of the drivers.
Reply to this comment...
Log in to comment
And the Speck too: https://github.com/jywarren/opk-speck-cli now running.
Reply to this comment...
Log in to comment
And taking note that for the Thermofisher and the Speck, we're only doing spot readings, not averages. This should change:
https://github.com/jywarren/opk-speck-cli/issues/2 https://github.com/jywarren/opk-thermofisher-pdr1500-cli/issues/1
Reply to this comment...
Log in to comment
Hey @mathew - wrote up a driver for the Dylos - it was very simple, just listening and it returns "0,0" every so often. If there's a manual or something I can set the units and perhaps change the sampling interval, but it seems to be basically working:
https://github.com/jywarren/opk-dylos-cli/issues
Reply to this comment...
Log in to comment
awesome!
Reply to this comment...
Log in to comment
Collecting notes on different sensors here! https://publiclab.org/q/15751
Reply to this comment...
Log in to comment
Login to comment.