What I want to do:
This note documents some code that I wrote to improve the feel of working with the graphic user interfaces (GUIs) written for our instruments. In our earlier GUIs, we have had the option of overlaying data on the charts, but unless each data set was individually saved, the files could not be accessed after the fact. Further, all the data were represented in the same color and it was not possible to tell which data set went with which experiment.
My attempts and results (in short):
I wrote a program for data manipulation in a graphic user interface, and will describe it in horrible detail below. Of course, a video demonstration would be a lot easier to follow, so it probably makes sense to check out the video at http://youtu.be/74MMU8NIE0o.
My attempts and results (in horrible detail):
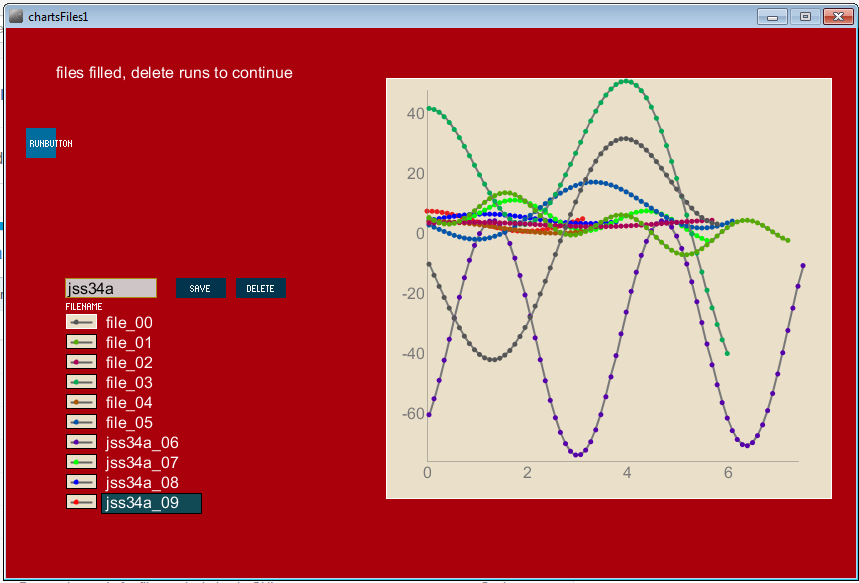
The program generates a dummy data set when you press a "play" button and graphs the data as it is generated. Pressing the play button a second time stops the data collection. The data is plotted in the chart area and there is a legend area where file names are listed along with an icon that shows you the color of the points for that file. The figure below shows a piece of the screenshot used at the top of this note:

The screenshot above shows the legend area with names and icons for ten data files (this is the maximum allowed by the program). File names can be specified prior to pressing the play button by typing a name into the text box above the legend section. The text box in the figure reads "jss34a", which you will see is the name given to each of the last four files in the series. You will notice that the file names also contain a two digit number that indicates the order the files were recorded in (00 was the first in this series, 09 was the last)
The figure also shows the lower left hand corner of the chart area. In the chart area, you can see parts of two data sets, one with purple data markers and one with gray markers. Looking at the colors of the icons in the legend area, it should be clear that the purple markers go with a file named jss34a_06 and the gray markers go with file_00. You will also notice that the file name for jss34a09 is on a dark blue background. That indicates that this file is selected. Pressing the "save" button above the legend area saves any files that are selected. Alternatively, pressing the "delete" button deletes all selected files. Files are selected and de-selected by clicking on the file name in the legend section of the gui.
Questions and next steps:
I would be happy to answer any questions that I can and would be grateful for any programming advice from those who have a better way to do this stuff.
The next step is to incorporate the new code into the GUIs for our existing instruments. I hope to get to this pretty soon for the WheeStat potentiostat and the Titraumatic automated titrator.
Downloading the program:
The program, called chartsFiles1, can be downloaded from our GitHub site, here. In order to run this, you will need to download the Processing program from processing.org. You will also need a couple of libraries to run the program (gicentreUtils and controlP5a). These need to be in the libraries folder in your Processing sketchbook. You can download the libraries from here and here, respectively. These files should be unzipped and placed into a folder titled "libraries" inside the processing folder. It is kind of important that your files are structured the way Processing expects to see them. On my computer it goes C:\Users\Summers\Documents\Processing\libraries . Inside the libraries folder there should be folders called controlP5 and gicentreUtils.
0 Comments
Login to comment.