What I want to do
In our last research note, we left off with a question -- what was causing our odd conductivity results?
Quick recap of our problem. To measure the conductivity of water, we're using the following circuit -- suggested to us by kindly folks at the CREATE lab at CMU:

Background. Basically, we're monitoring the voltage across a capacitor that is in series with electrodes that are sitting in water. When we apply a high voltage to "IN", the capacitor C starts charging up; and the rate of charging depends on the combined resistance of the resistor we've placed in the circuit, R, as well as Rwater, the resistance of the water between the two electrodes. We then measure the time it takes for the voltage across the capacitor ("Vout" in the diagram) to reach a threshold value ("Vref" + some amount, delta), as one metric for the conductivity of the water between the electrodes. We then apply a low voltage to "IN", and the capacitor C starts discharging -- the rate of discharge is again dependent on (R + Rwater) -- and we measure the time it takes for "Vout" to decrease down to ("Vref" - some amount, delta) . The idea is that we measure independently the time taken to charge, and discharge, the capacitor -- and both of these numbers should reflect, in some way (yet to be determined / calibrated precisely), the relative conductivity of the solution. By continuously cycling "IN" from 'high' to 'low voltage', and monitoring these 'capacitor charge / discharge' times, we can thus track the conductivity over time.
Weird Results
So, after putting the circuit together, our first test was to take two screws that were lying around in Ben's pad, and try our test out in some water. Here were the confusing results:

The upper plot is the 'capacitor discharge time for one cycle' as a function of cycle index, and the lower plot is 'capacitor charge time for one cycle' as a function of cycle index. You see in the plot that both numbers are exhibiting significant drift over short periods of time (each 'cycle' is take once a second, so we're seeing conductivity change significantly over the course of just a minute or so).
Even worse ...
Furthermore, this drift effect is huge compared to very substantial changes in salt concentration -- one of the initial 'jumps' in our signal corresponds to having dumped in a bunch saline solution, and the difference in signal was quickly overwhelmed by the signal 'drift':

And, on top of all that -- what's going on with the strange difference in behavior exhibited in the top and bottom curves? Our expectation was that the time to 'charge' and 'discharge' the capacitor should be pretty similar ...
What is to be done?
So, Ben set about trying to figure out what was going on. We considered ambient temperature differences, problems with the firmware, corrosion of the electrodes ... at some point we even took the probe out of water, and tried a resistor across the electrodes.
To make sure that the problem wasn't simply corrosion, we redid our setup with two stainless steel wires. At first this seemed to fix the problem, but we were still noticing significant drift.
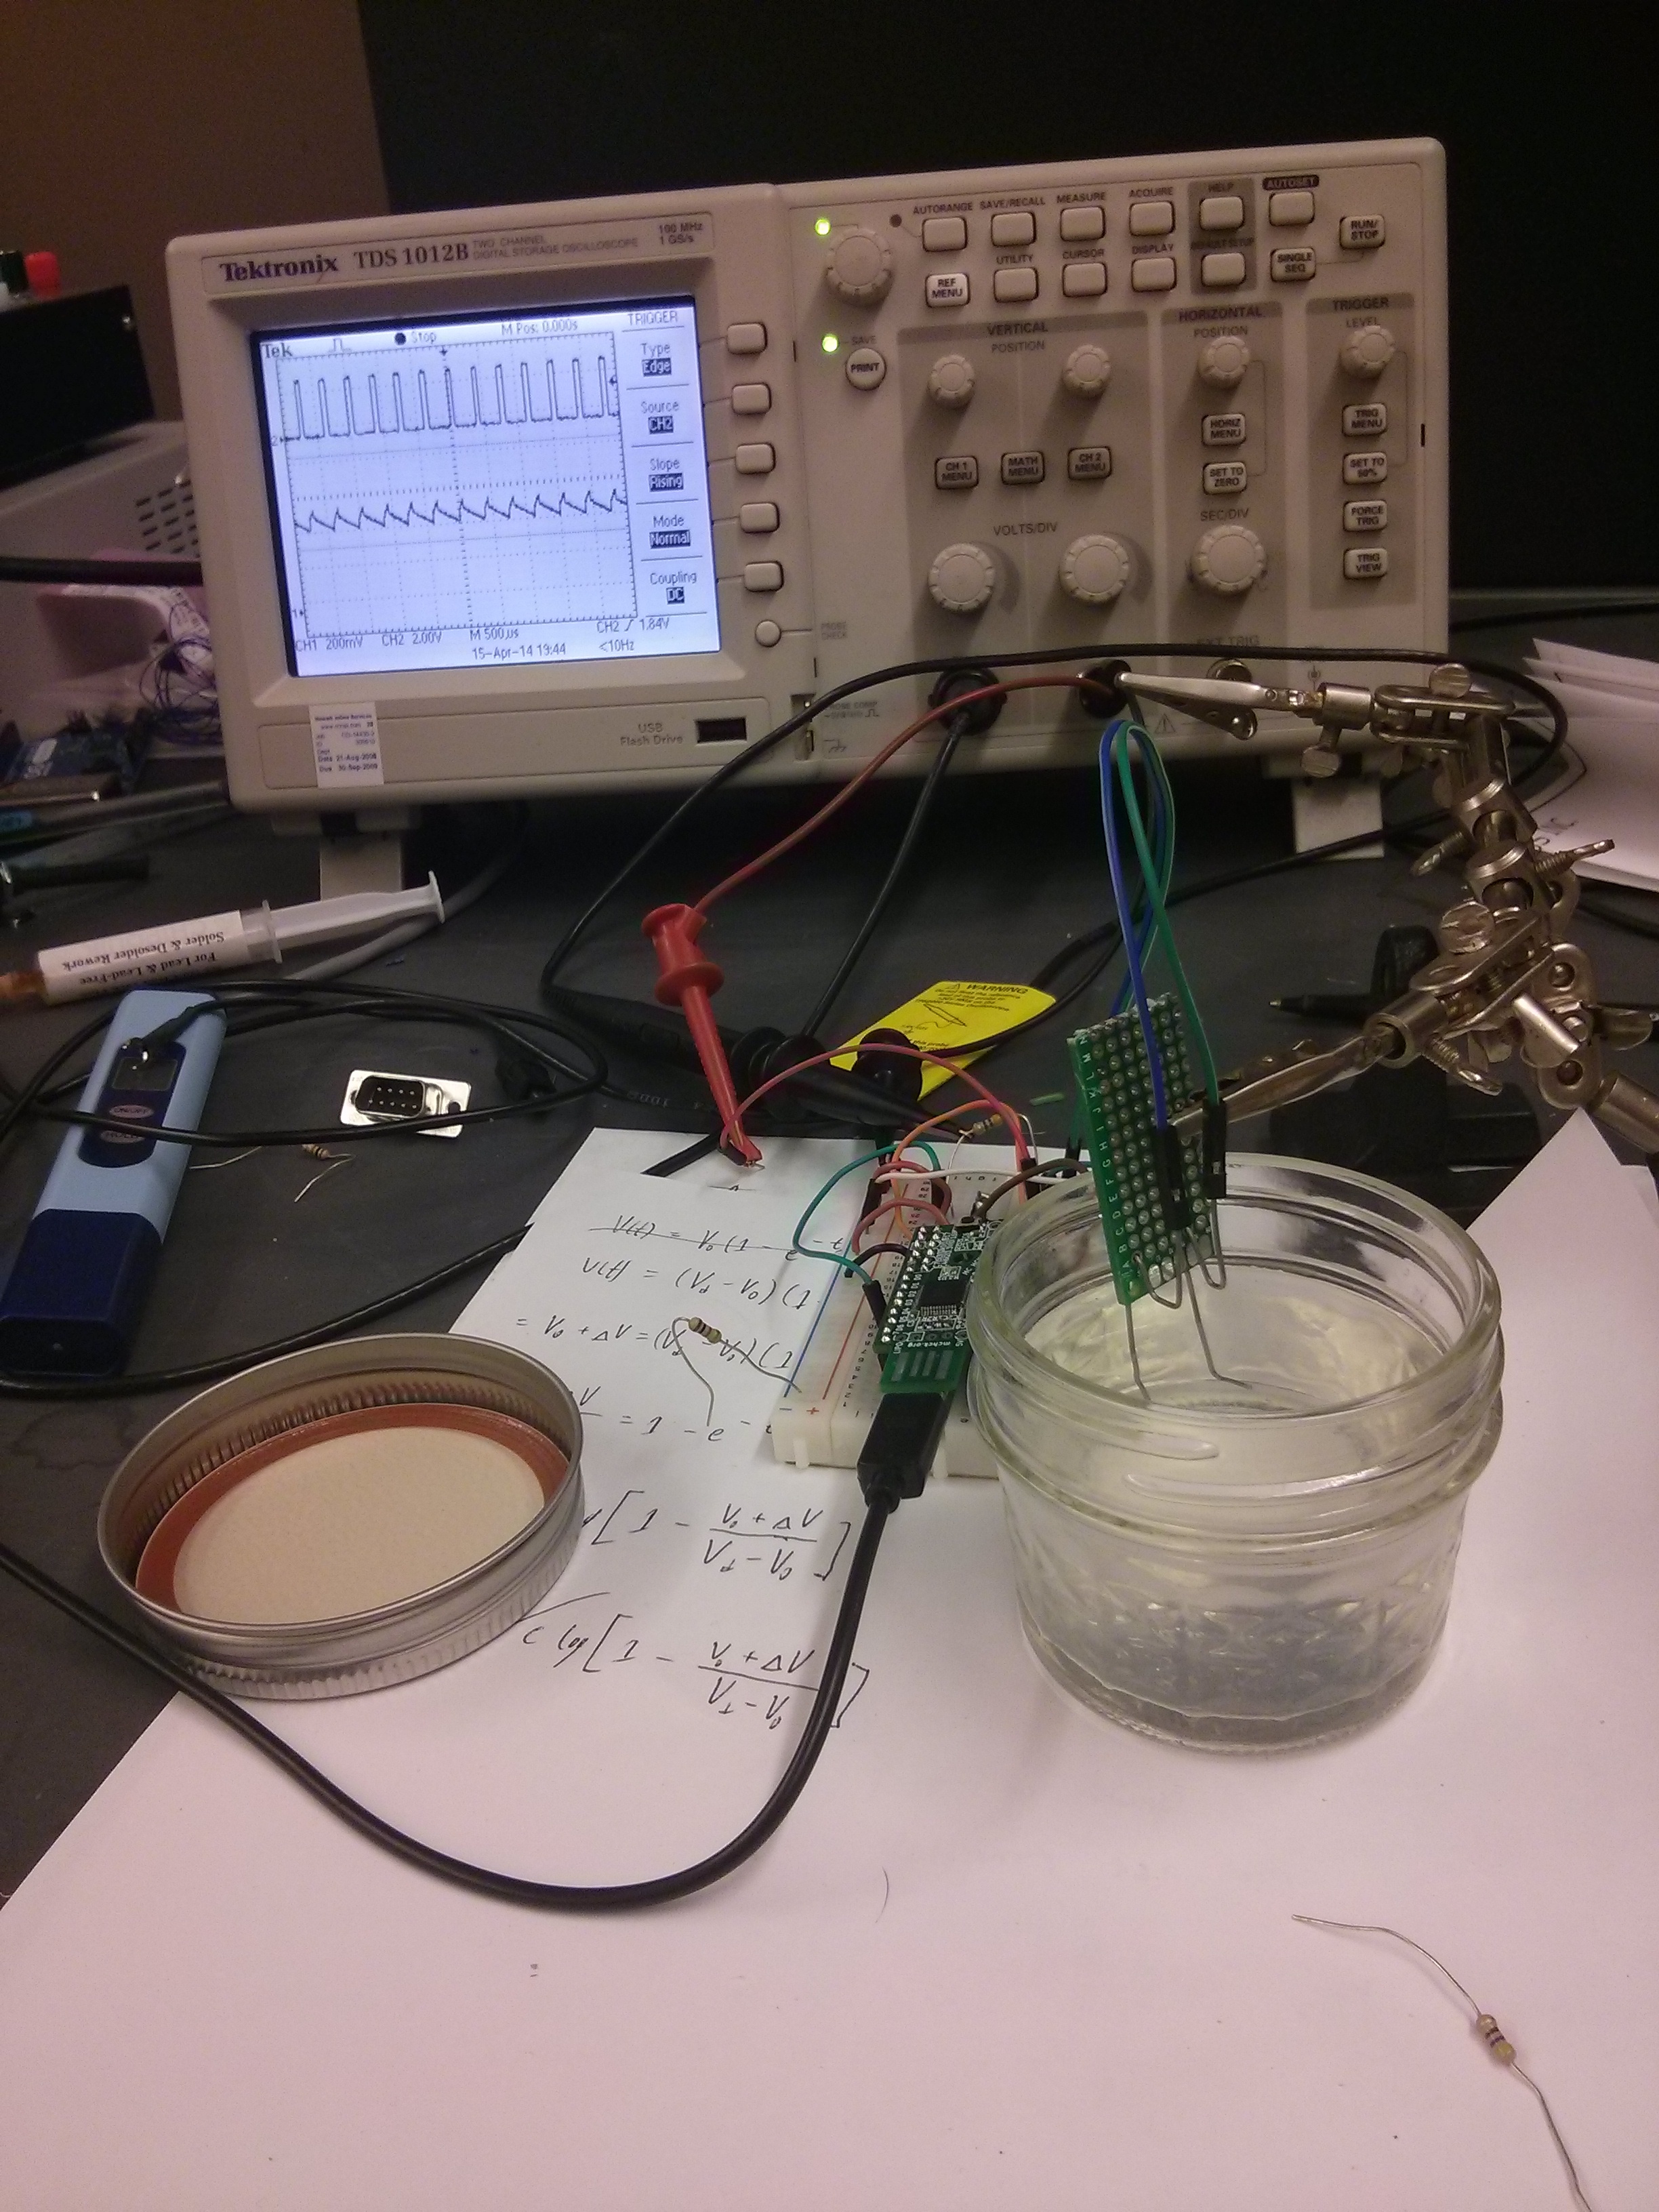
Then Ben realized: his stainless steel wire setup was connected to a perfboard, and some of the perfboard copper, electrically connected to our circuit, was sitting in the water along with the stainless steel. A previously unidentified source of corrosion in the system! So Ben rearranged the probe setup so that only the wire tips were dangling into the solution:

(Note the picture of the oscilloscope in the background -- a very useful diagnostic tool for this sort of AC signal work! It'd be great if digital oscilloscopes were less pricey ... alas ... )
He started collecting data, and ...
Provisional success!

Woohoo! His initial measurement of the solution's conductivity now looked as flat as ... something really, really flat! A steady conductivity signal, over around 12 minutes (each 'cycle' number on the x-axis represents another .5 seconds).
Further, now the 'fall' (top curve) and 'fall' (bottom curve) plots resemble one another much more. Seems like we're getting somewhere ...
Add a pinch more salt ...
So then Ben tried the following: he began by adding a lot of salt to some tap water, and then measured the conductivity as he diluted the solution. Here's what he got:

Woohoo! The various salt concentrations for the above plot were:
t=150 through t=275 -- 2470uS/cm
t=275 through t=500 -- 1550uS/cm
t=500 through t=675 -- 1270uS/cm
Many, many more pinches ...
We quickly checked a table of some common salt concentrations, and realized that it'd be nice to keep diluting further, and watch the signal evolve. For example, here are some common salt concentrations in water, in uS/cm:
Distilled water: 0.5 uS/cm Domestic "tap" water: 500-800 Potable water (max): 1055 uS/cm Sea water: 56,000 uS/ cm Brackish water: 100,000 uS/cm
He diluted the solution all the way down to near the level of Amherst tap water (94 μS/cm, at the location he was measuring):

The corresponding concentrations in the above plot are here, where 't' is the time index on the bottom of the chart (each time tick = .5 seconds):
t=150 through t=275 -- 2470 μS/cm
t=275 through t=500 -- 1550 μS/cm
t=500 through t=1000 -- 1270 μS/cm (close to the max for potable water)
t=1000 through t=1600 -- 588 μS/cm (some domestic tap water)
t=1600 through t=1800 -- 476 μS/cm
t=1800 through t=2100 -- 410 μS/cm
t=2100 through t=2800 -- 307 μS/cm
t=2800 through t=3200 -- 227 μS/cm
t=3200 through t=3600 -- 179 μS/cm *
t=3600 through t=3900 -- 153 μS/cm
t=3900 through t=4100 -- 134 μS/cm
t=4100 onward -- 122 μS/cm (close to Amherst tap water -- yay, Amherst!)
- slight bump during this data-point due to fiddling with scope probe attenuation
Whee!
It seems that we can nicely distinguish various conductivity levels!
Questions and next steps
We can still see a bit of a drift issue in that last plot at the lowest conductivity values (see how the final 'semi-plateau' in our plot trends down / up for the top / bottom curves in that last plot, above). Our current thinking about this is as follows. Our measurement of the 'charge / discharge' on the capacitor involves an oscillatory signal (apply a 'high' voltage on the 'IN' pin, wait until the capacitor C reaches a 'high voltage' threshold, and record the time it takes for this to happen; then apply a 'low' voltage on the 'IN' pin, wait until the capacitor C reaches a 'low voltage' threshold, and record the time it takes for this to happen; repeat ...). This oscillation a) allows us to assess the level of conductivity by measuring the capacitor C's charging / discharging time, but it also b) helps prevent polarization in the water / at the electrodes by alternating the direction of the electric field between the two electrodes -- especially if the oscillation is rapid (1 kHz or more). A possible issue, however, is that when the conductivity of the water is very low, our circuit's oscillation frequency becomes sufficiently low that polarization becomes a significant effect. We might be able to boost the oscillation frequency by choosing a different capacitance value, C, and we're going to try this out next. We'll also likely have some stainless steel screws arriving in the mail tomorrow, which we're eager to try as electrodes ... stay tuned!
8 Comments
Just noticed -- in that last plot, it looks like the 'falling times' (top curve) start 'slumping', whilie the 'rising times' (bottom curve) seem relatively steady -- is this because of differences in scale? Why would this be? Are 'rising times' (the time taken to charge the capacitor) relatively impervious to polarization effects? If so -- and I don't understand why this would be the case -- can we exploit this to assess the impact of polarization in our circuit?
Is this a question? Click here to post it to the Questions page.
Reply to this comment...
Log in to comment
What is the max amplitude of the voltages you are applying across the screws? If this gets too high you could be electrolyzing the water, other ions/crap in the water, or worse corroding the metals in your electrodes which may lead to long term drift. I think limiting voltages to below 0.1V should be sufficient to minimize these effects.
To understand the effect of "polarization" you want to be thinking of a circuit model for the electrode-solution system. At suficiently low voltages, no electrolyzing "Faradaic" DC current should be produced in the system. As you apply a voltage jump between the electrodes, the charges in the solution rush to the electrode of opposite sign and start piling up there over time and "polarizing" the electrodes leading to a transient decaying current; you can think of this as charging up a very large capacitance (call this C_ep could be around 1-100 uF) that is proportional to the surface area of the electrodes and inversely proportional to the very tiny charge separation on the order of ~3nm between ions in the solution and an excess (or deficit) of electrons on the electrode surface.
Your measurement is a little more complicated with a capacitance C_m (that you choose) which would be in series with C_ep, the solution resistance R_s, and the measurement resistance R_m (which you can also choose). Capacitances in series combine as C_tot = 1/(1/C1 + 1/C2), so if C_m << C_ep then you can neglect the effects of polarization since the combination will be dominated by the smaller capacitance. At moderate to high ion concenrations C_ep behaves like a large relatively fixed value since the charge layer is compact. BUT, at very low ion concentrations C_ep can get much smaller and highly temperature dependent as the ions tend to form a diffuse layer. (See double layer model for more info.)This latter condition is very hard to calibrate out and is best written off as a limitation of the measurement technique.
Is this a question? Click here to post it to the Questions page.
Reply to this comment...
Log in to comment
nice work - it's great to see that the conductivity measurement is coming along like this!
Reply to this comment...
Log in to comment
Cversek -- wow, thank you!!! What a useful collection of info. Your note convinced Ben to add a dual op-amp to buffer the conductivity output, and a low voltage drive rail. He just updated the schematic, and I'm going to be trying to lay out the new board now. Really great to have this commentary as part of this research note, for later reference. Thanks!
Kanarinka -- yes! We're really honing in a relatively robust, inexpensive technique, it seems ... woohoo!
Reply to this comment...
Log in to comment
Hi Don, I agree with Cversek that you need to keep the voltage difference small. you also might want to look at using graphite electrodes. The kinetics of water redox reactions is dependent on the chemical identity of the electrodes and carbon is pretty good for limiting this (not as good as mercury, but I am pretty sure you dont want to go there). In addition to complicating the measurement of RC behavior of the solution, water hydrolysis can cause bubbles to form on your electrodes changing their effective surface area and consequently the time required to charge and discharge your capacitor.
I would like to point out that we wrote a research note on measuring conductivity a while back (http://publiclab.org/notes/JSummers/11-21-2013/conductivity-meter). The instrument described in that note generates a square wave with 100 mV amplitude and measures the AC current passed between the two electrodes. We have not been working on this project lately because I haven't had a student show much interest in it. I recall that when we had this project active, I intended to drop the voltage lower, to perhaps 50 mV peak to peak or perhaps even lower. Since the current for this type of measurement drops off exponentially after the voltage step, the sensitivity of the measurement can be adjusted by changing the delay between the voltage step and the current measurement. This can be easily done in the code.
There is also a method in a book called "Environmental monitoring with Arduino" by by Emily Gertz and Patrick Di Justo (O’Reilly Media, Inc., Sebastopol, CA). Chapter 5 in this book is called: Water Conductivity / Numerical Output and describes a simple conductivity meter.
Reply to this comment...
Log in to comment
Over the last few days I've been busily reworking some aspects of the measurement. Now we have a much lower excitation voltage (currently 100mV, although this could be easily decreased further) in addition to much-improved buffering of the resulting output voltage (which was previously quite sensitive to digital noise). Hopefully I'll be able to put together some experiments demonstrating this over the weekend.
Reply to this comment...
Log in to comment
I would be glad to send some SS welding rods to you free of charge... you have access to the scope and tools I do not... I planted the garden today...
Reply to this comment...
Log in to comment
Also, FWIW, not all stainless steels are the same. For instance, 316 SS is more resistant to corrosion than 304.
Reply to this comment...
Log in to comment
Login to comment.