Spectralworkbench Blog
How does the Spectral Workbench intensity measuring work?
Edit: I solved it. Sorry for any inconveniences.
I would like to learn how Spectral Workbench measures light intensity for each wavelength.
Follow related tags:
spectralworkbench spectral-analysis question:general
I just made my Papercraft Spectrometer and have no idea what to next!
How do I use my phone with Papercraft Spectrometer?
Follow related tags:
spectrometer spectralworkbench spectrometry software
I just made my Papercraft Spectrometer and have no idea what to next!
How do I use my phone with Papercraft Spectrometer?
Follow related tags:
spectrometer spectralworkbench spectrometry software

Built the entry level paperkit
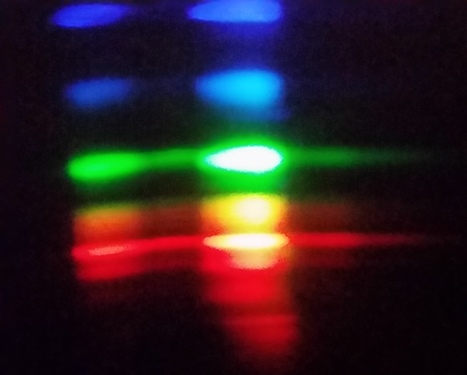
I built the entry level, paper-foldable spectrophotometer just before New Years. The experience I had and the lessons I learned are below.
1.) First, I tried it out of paper. That is super easy because you just have to print out the form, cut and then fold, but the paper is not thick enough to block out extraneous light. I was able to improve it by wrapping the front of the small box with black electrician's tape. It worked . . . sort of.
2.) Getting the aperature right is a big deal and not that easy to do. I ended up 3d printing an appoximate aperature and then using electrician's tape to make the aperature closer to the 0.4mm that is suggested. Unfortunately, my 3d printer is not accurate enough to just print a small slot like that.
3.) I'm getting spectral images from the CFL lights but the resolution is no where near the 1 nm that is mentioned as possible.
Therefore, I'm ready to buy the desktop reference design with the web cam and the aperature kit. I think that will be easier to use (it is hard to hold the box onto your smartphone camera while snapping a picture) and hope that it will be more precise.
Follow related tags:
spectrometer spectralworkbench assembly kit
CSV files from spectra
What are the units in the CSV files? The wavelengths are provided in the far left, but the values for the blue, green, and red peaks are different from the %intensity that can be obtained from scrolling along the spectra graphs with the mouse. The values are over 100, so it doesn't appear to be the % transmittance. The values are also too high for absorbance. Could someone please clarify for me? Thank you.
Follow related tags:
spectrometer spectralworkbench cd question:spectral-workbench
How to use the API to export a constant stream of data?
I used the $W.data command in the chrome console, and I was able to get data at that time of the intensity of the wavelengths, I would like to be able to get constantly updating information, and export it to an arduino sketch, is there a command for that?
Follow related tags:
arduino spectralworkbench spectral-workbench-api question:spectral-workbench